Sotheby’s International Realty Manhattan Q1 2026 Market Report

Manhattan Q1 Market Report 2026

  • April 20, 2026

    Sotheby’s International Realty Manhattan Q1 2026 Market Report
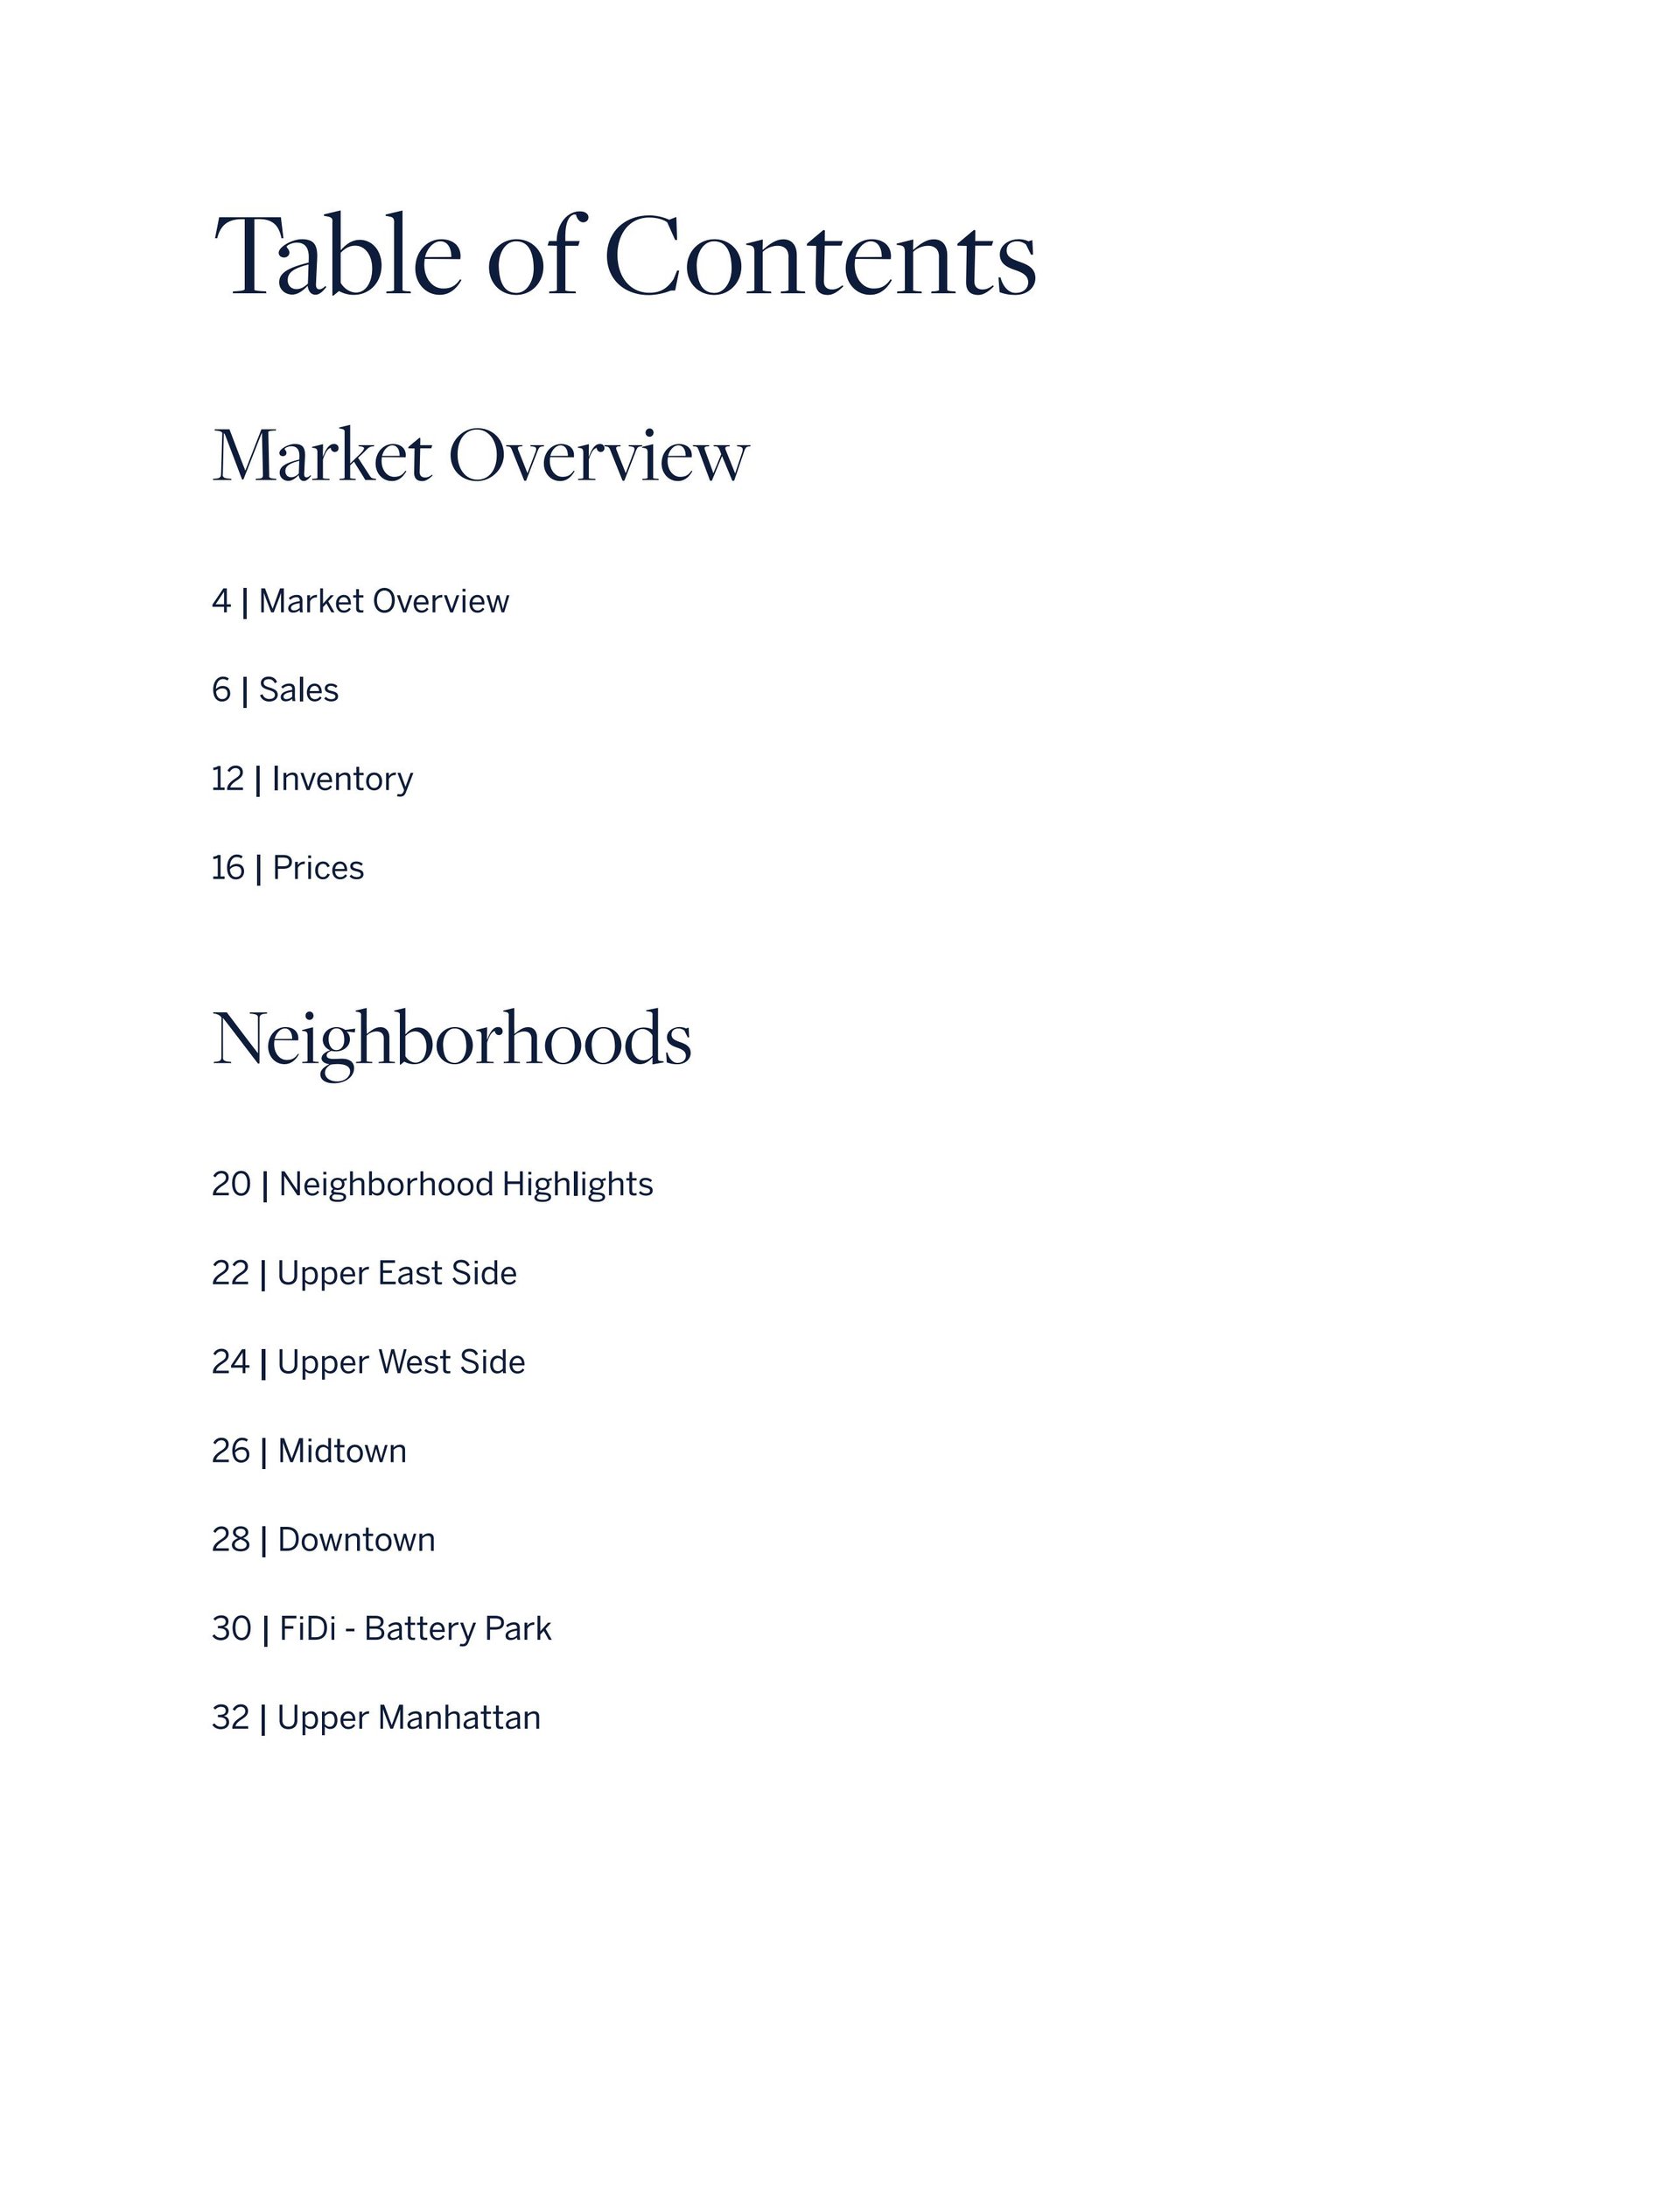
Table of contents for a Manhattan market report, listing market topics and neighborhood sections.
Manhattan skyline and Central Park behind the title “Market Overview.”
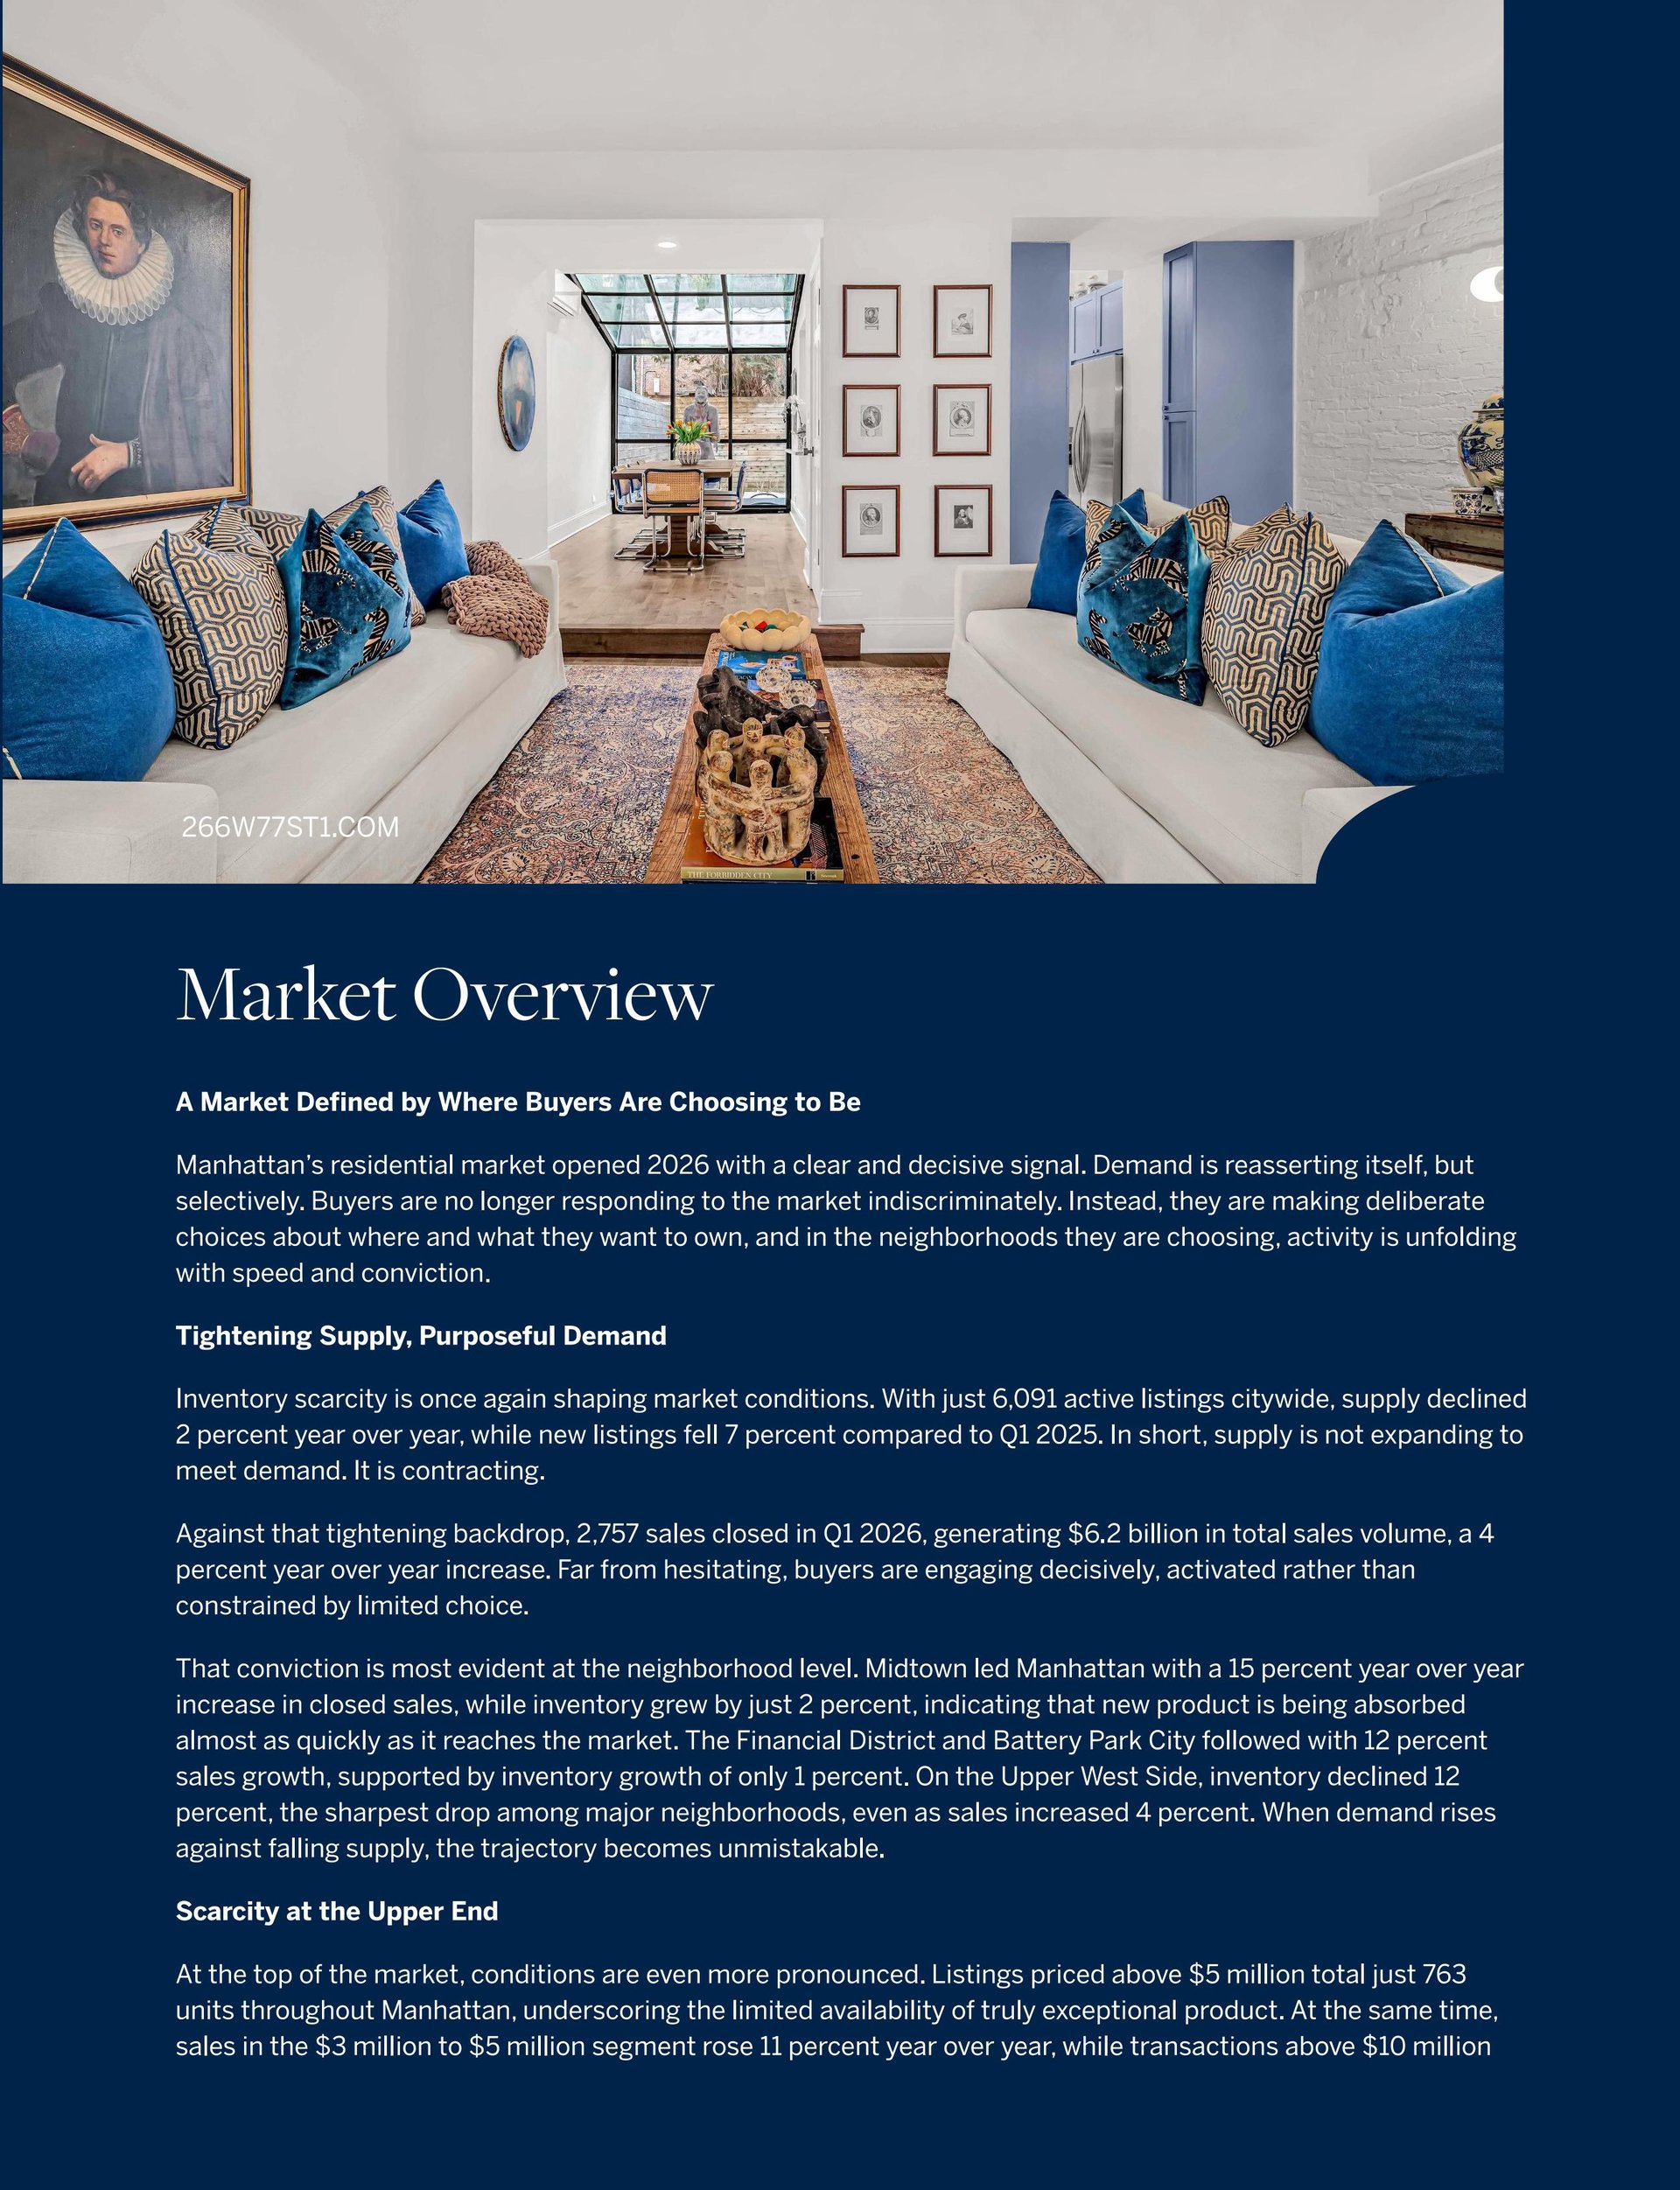
Manhattan Q1 2026 market overview report page with a furnished living room photo and market analysis.
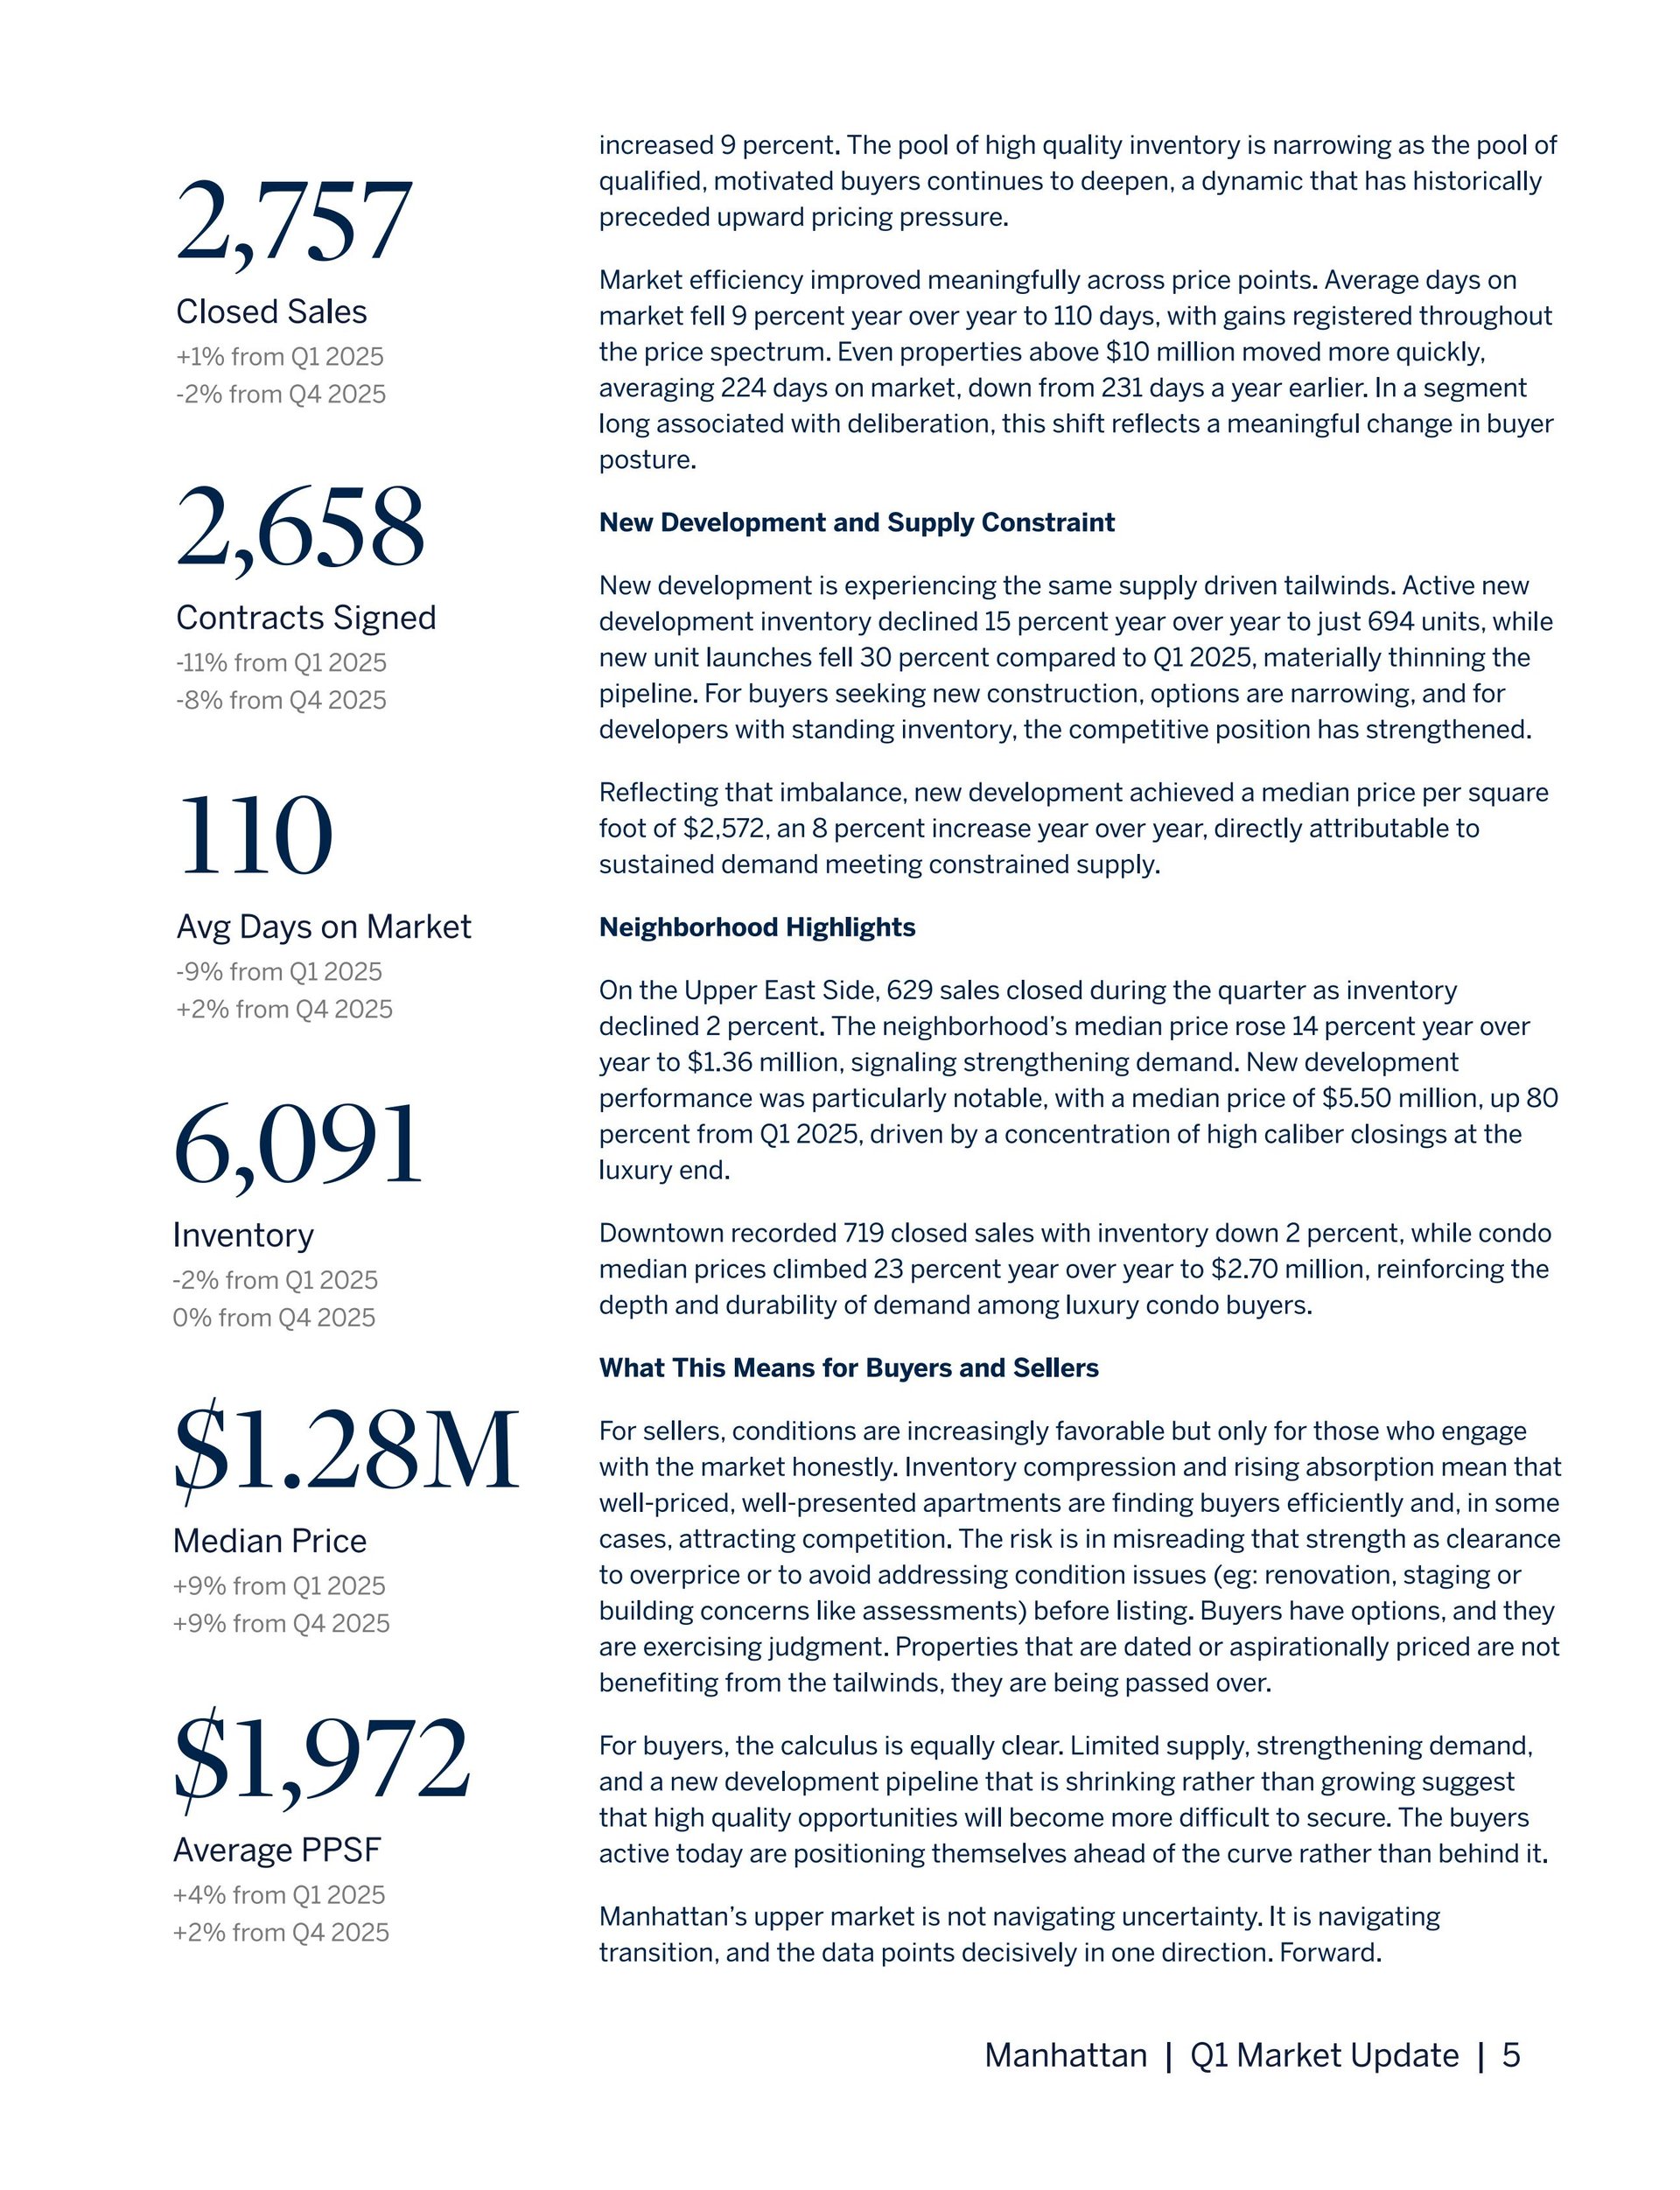
Manhattan Q1 market report page with sales, inventory, pricing statistics, and analysis of supply and neighborhoods.
Manhattan high-rises framed by leafy trees, with “Sales” overlaid.
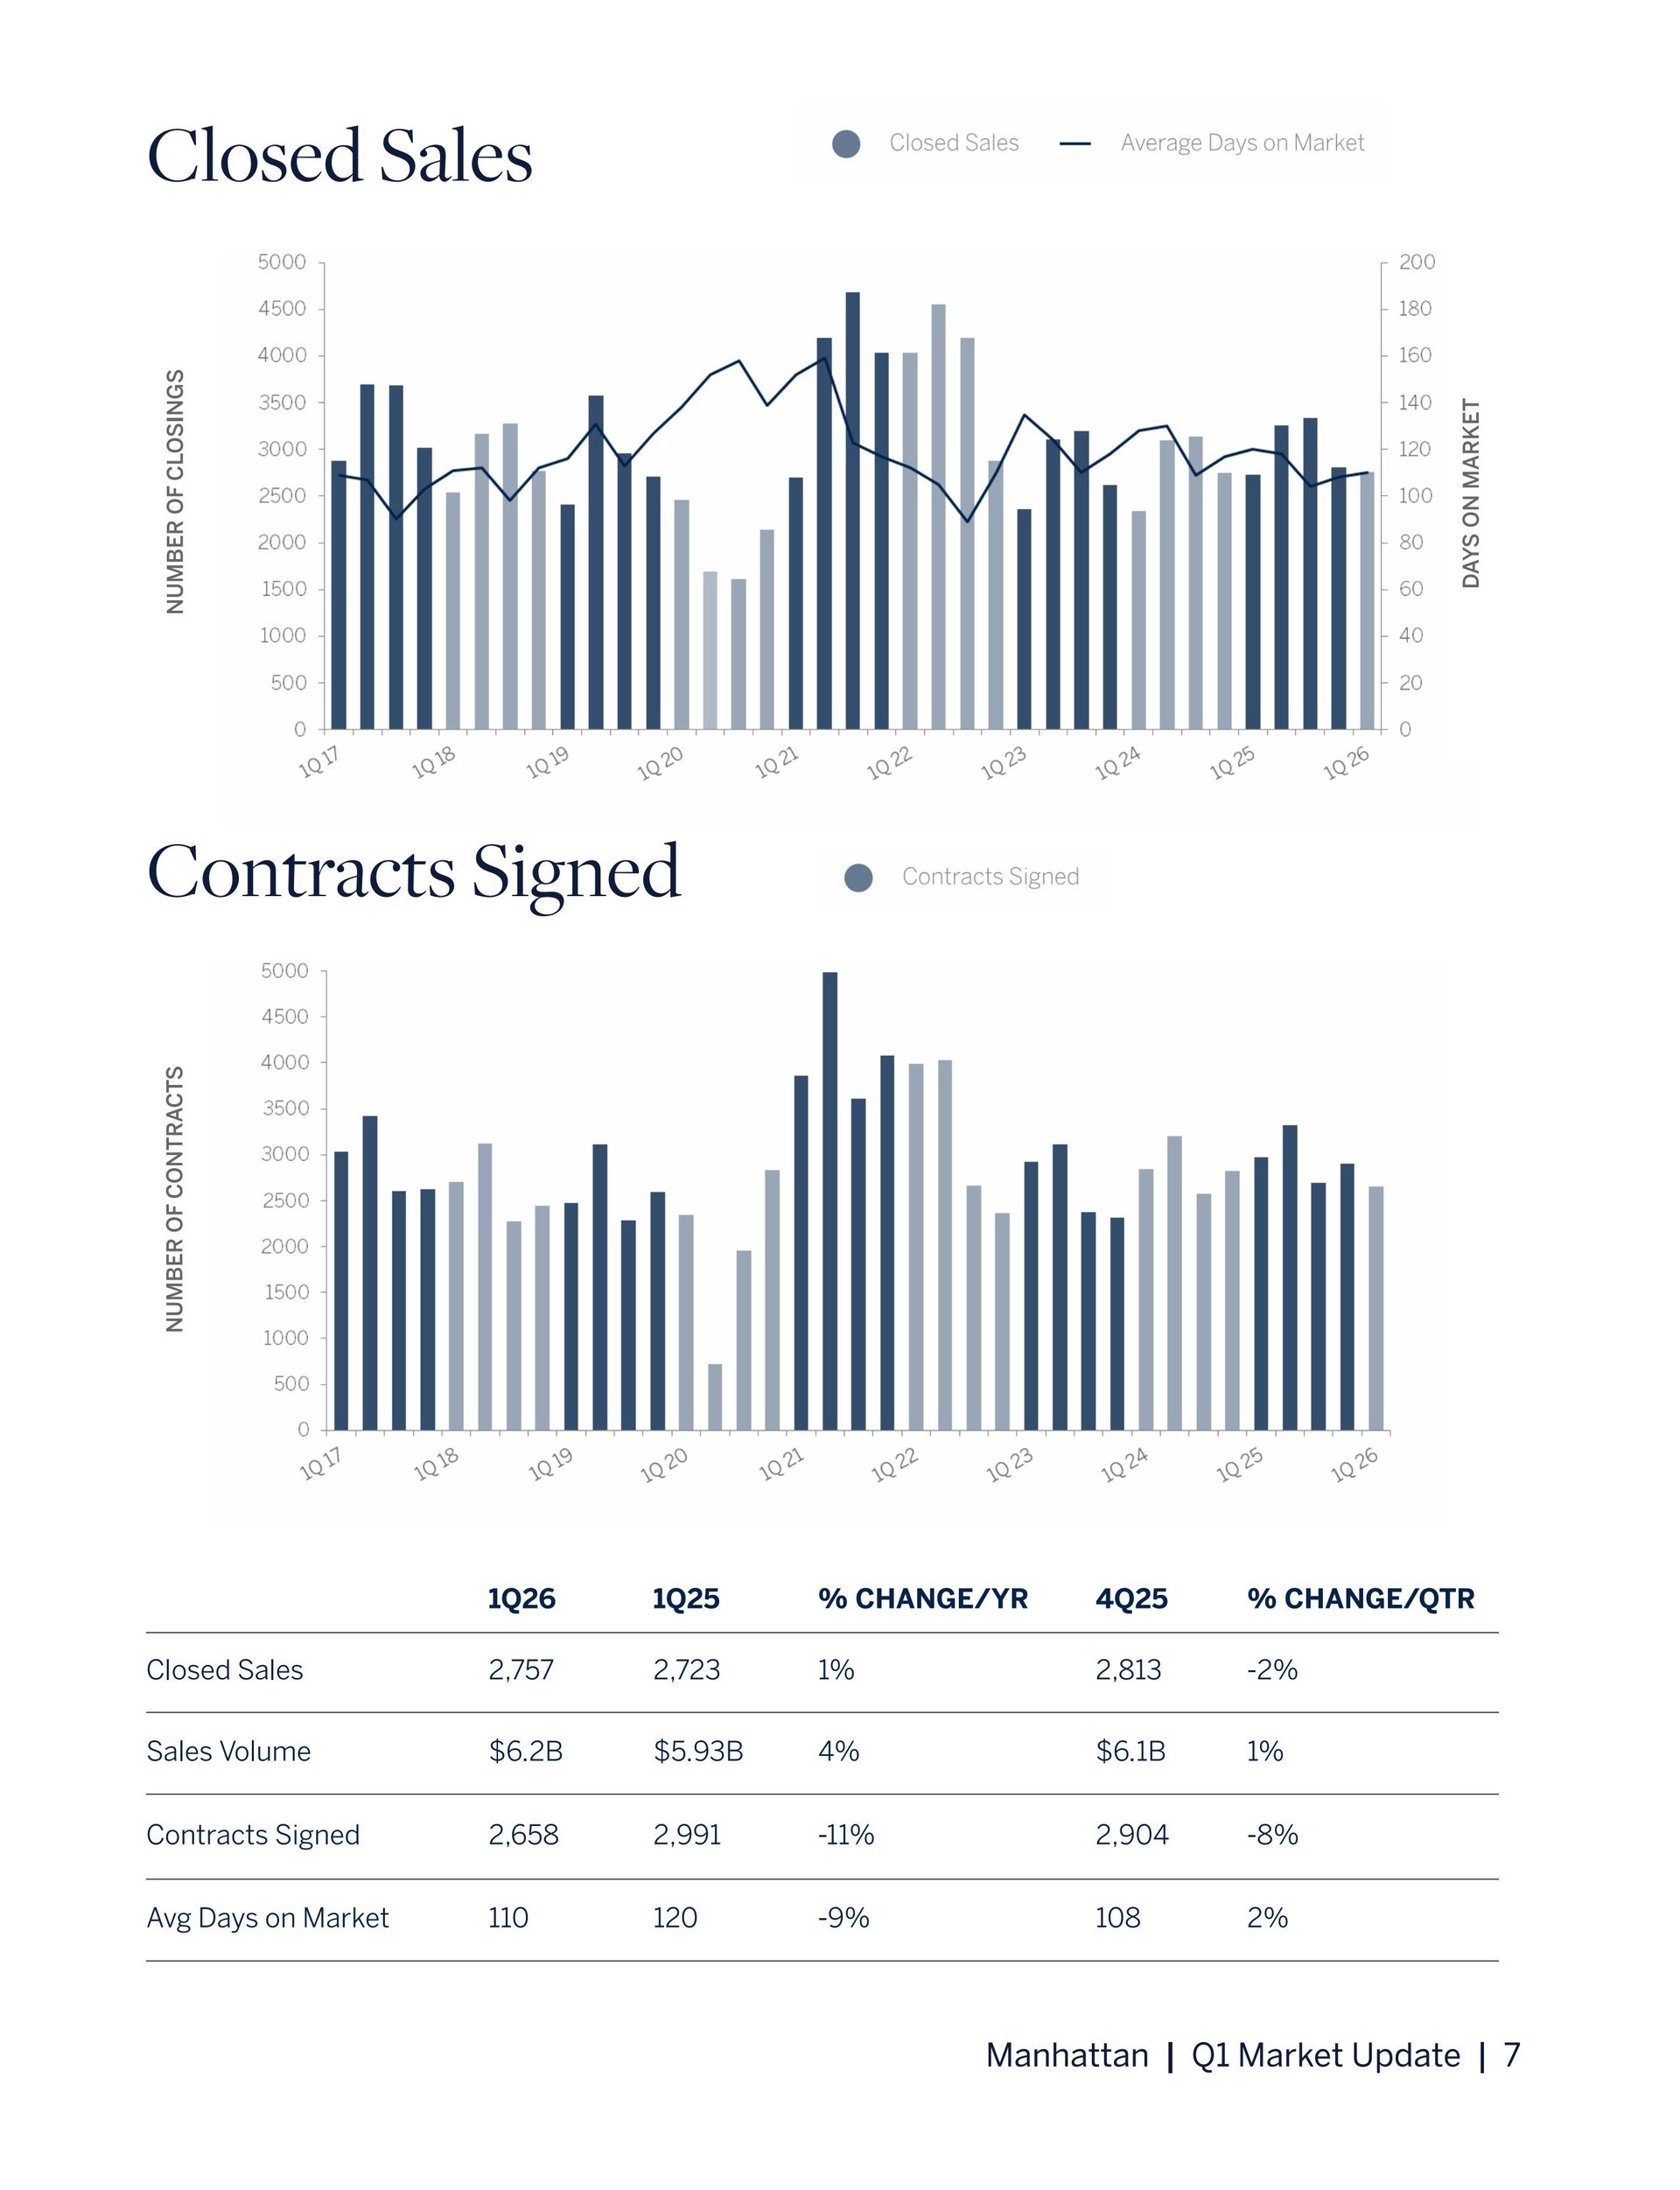
Manhattan Q1 market charts and table compare closed sales, contracts, and days on market.
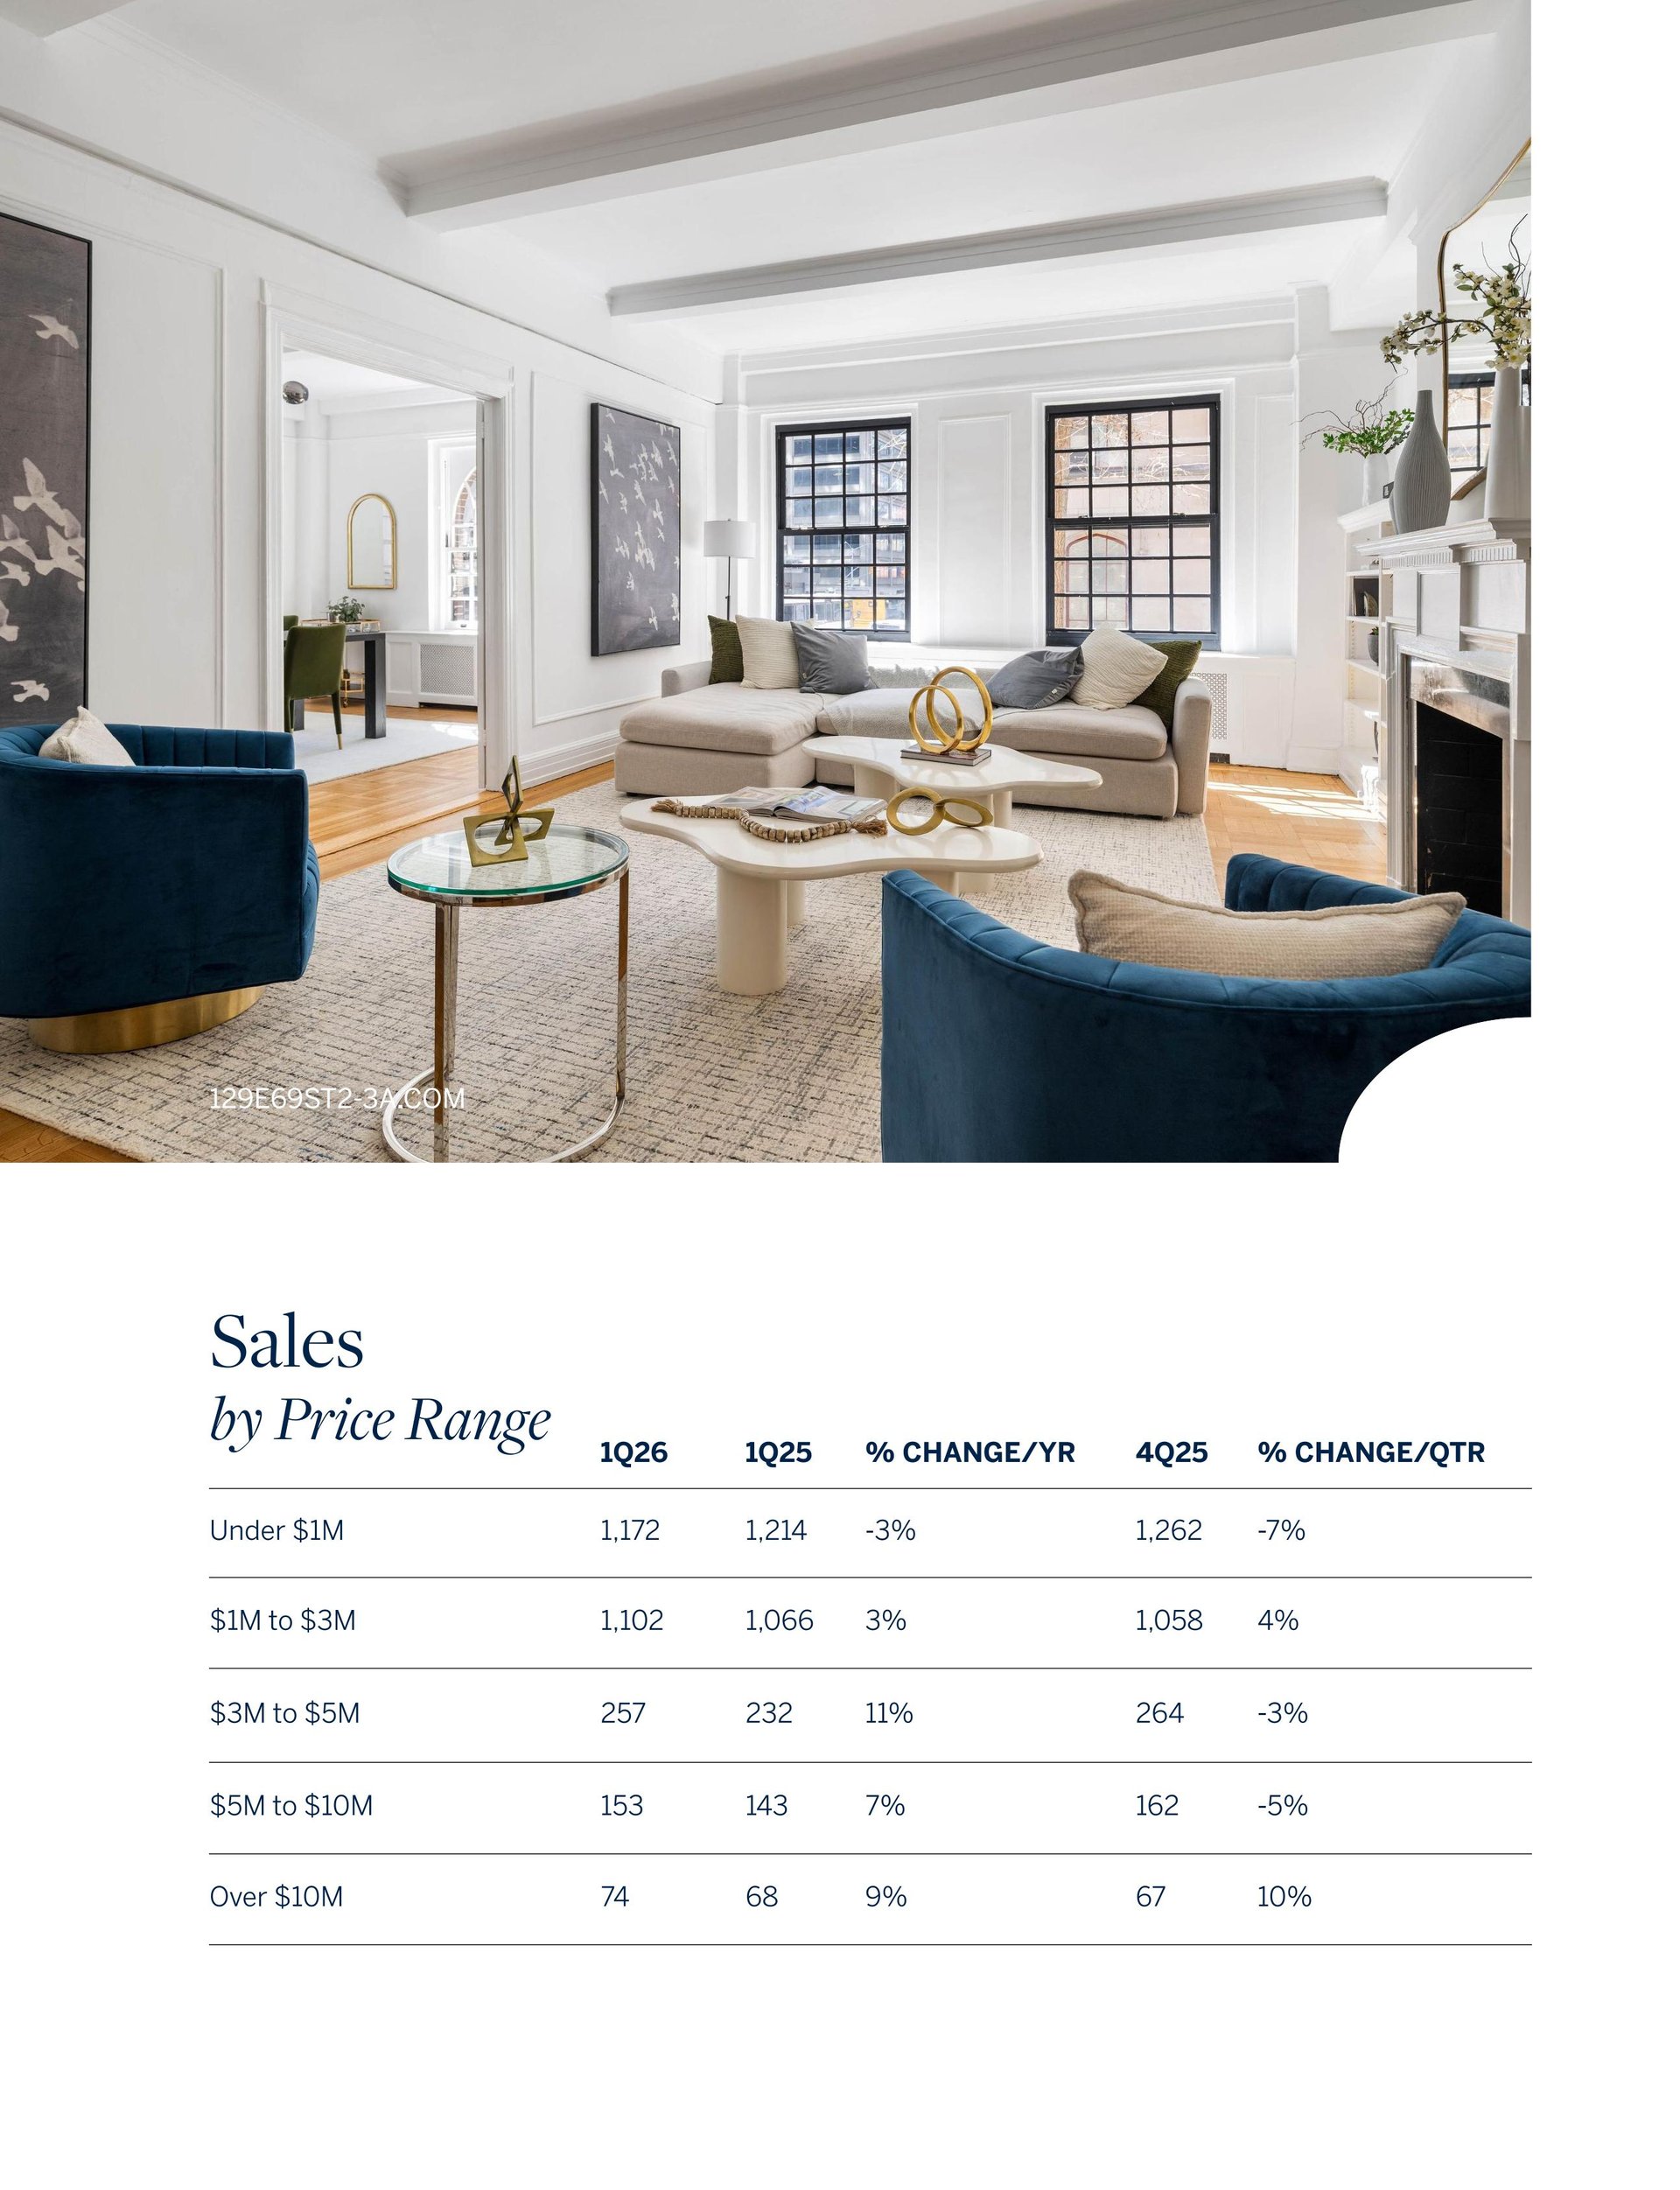
Manhattan Q1 2026 sales by price range table beneath a bright living room with blue chairs and a beige sofa.
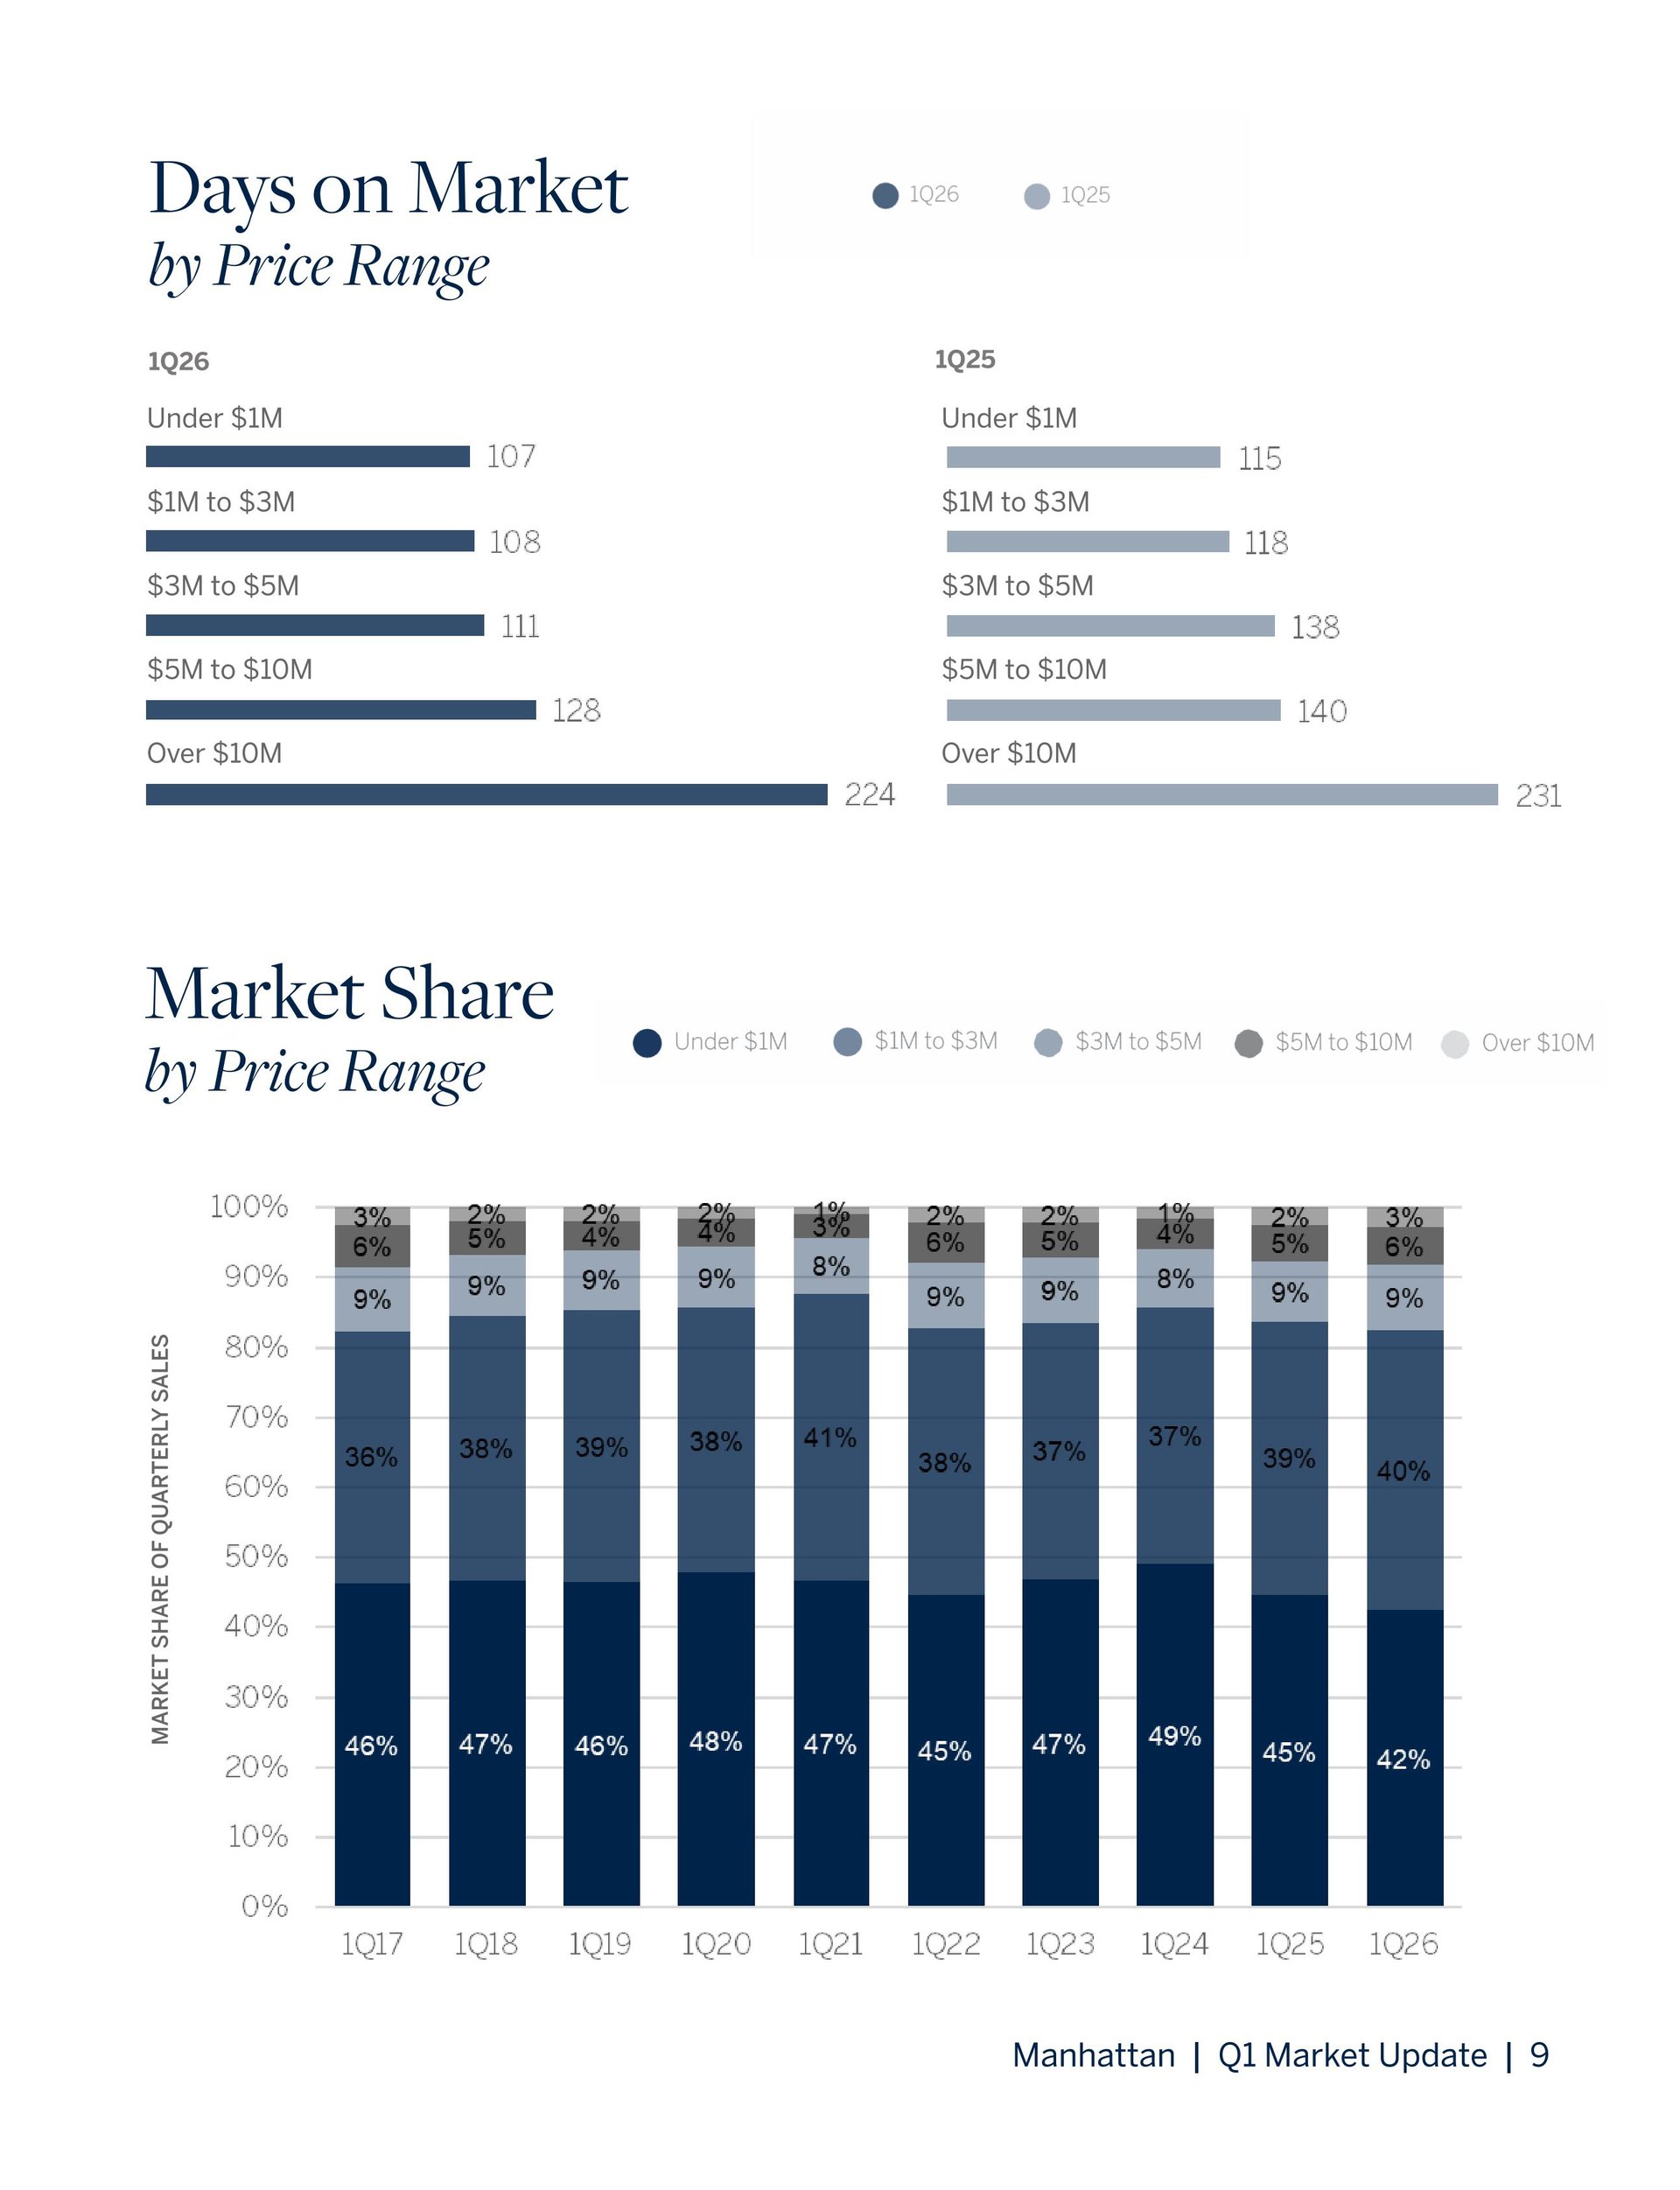
Manhattan Q1 market charts compare days on market and sales shares by price range.
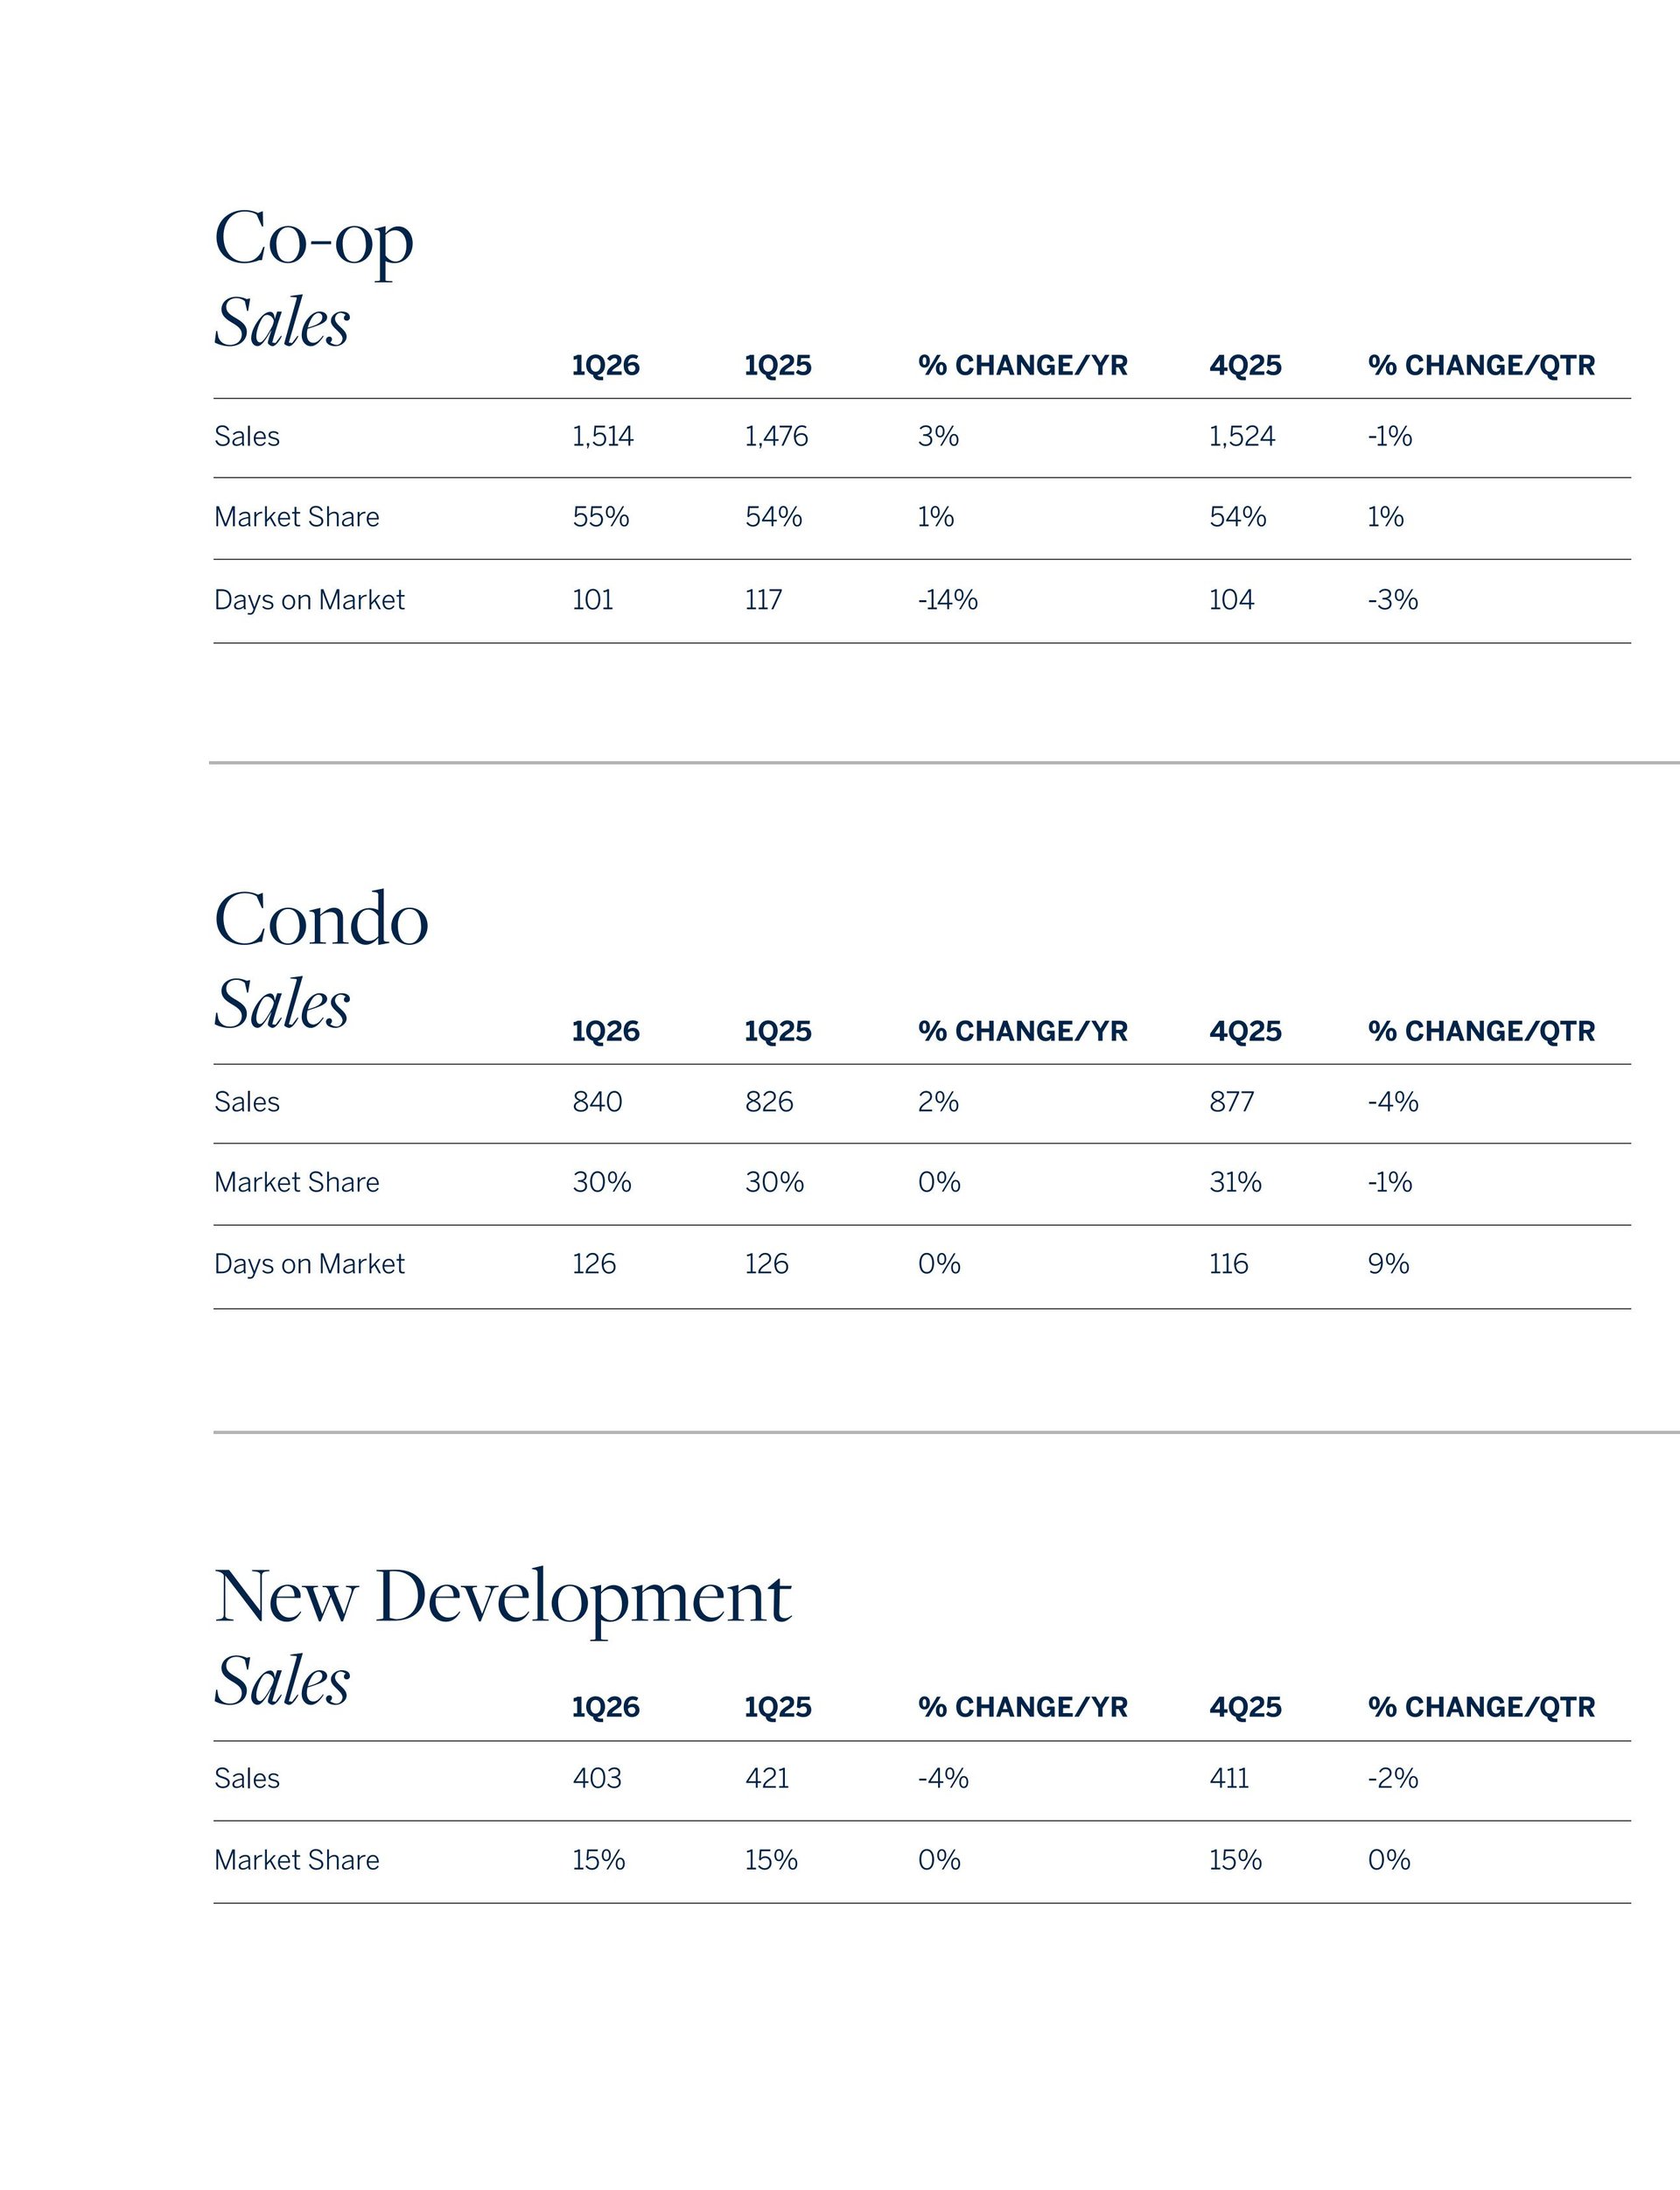
Manhattan Q1 2026 sales tables comparing co-op, condo, and new development market figures.
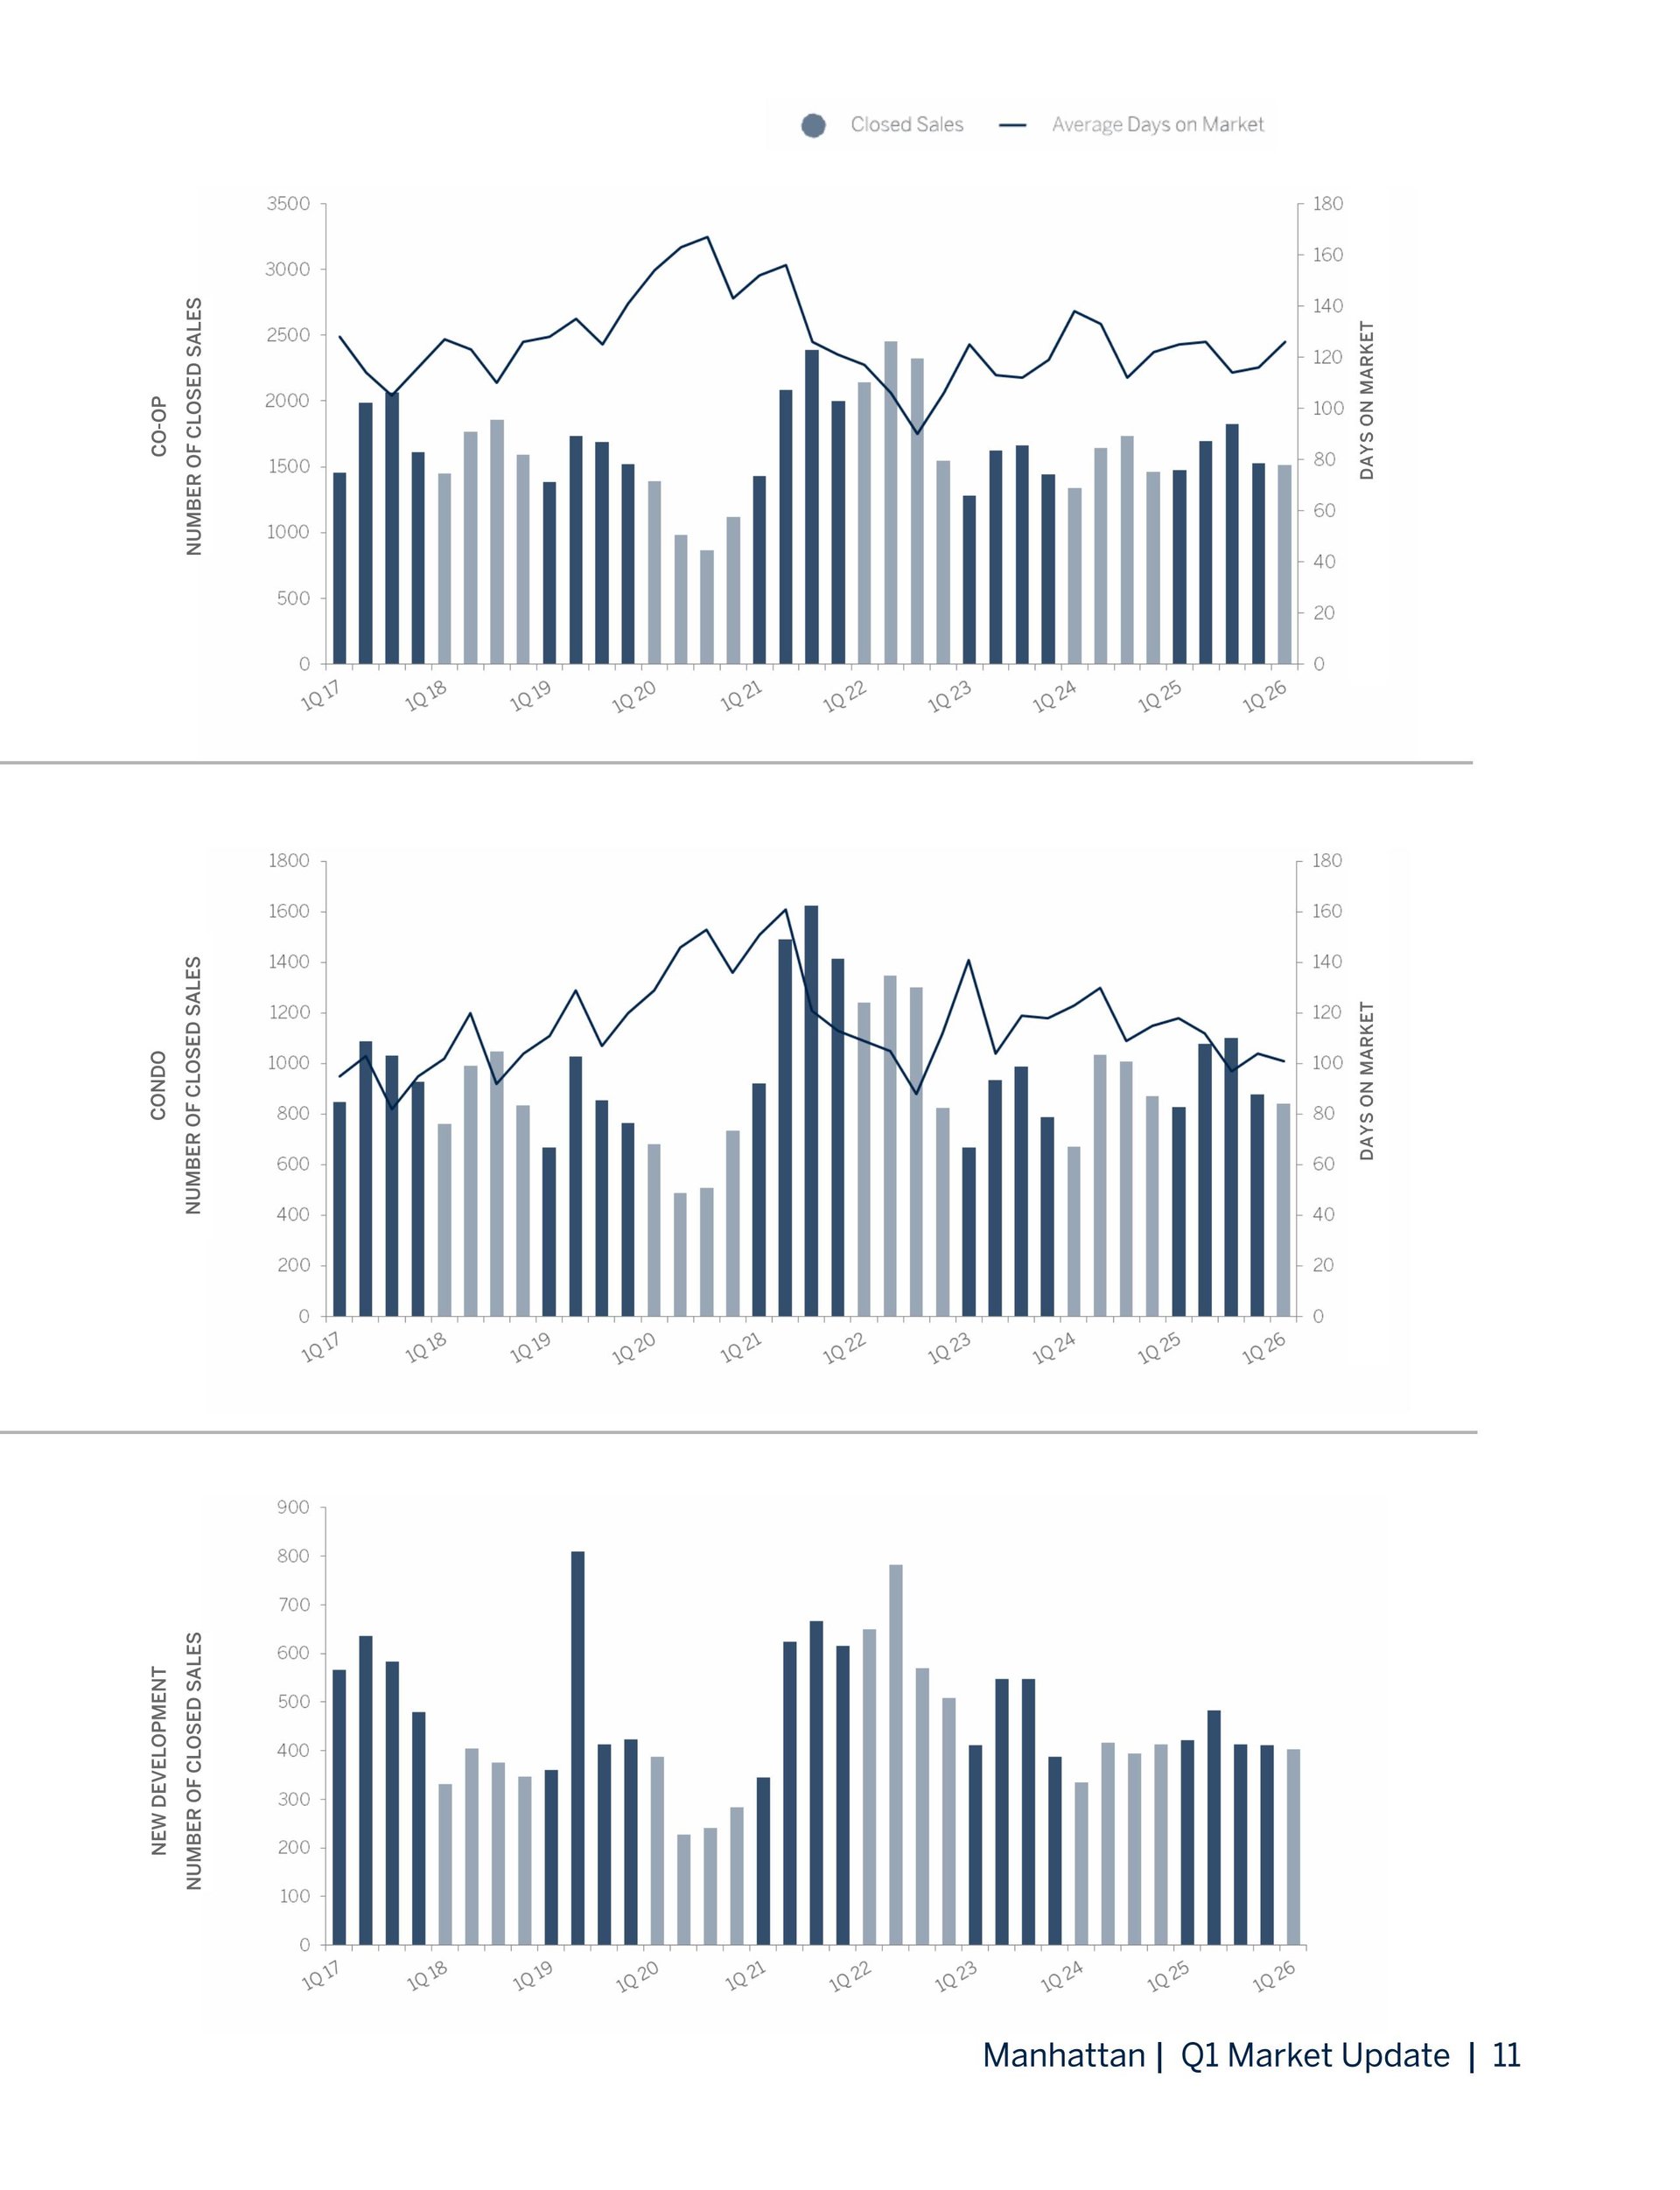
Manhattan quarterly closed sales and days on market for co-ops, condos, and new developments, 2017–2026.
Manhattan skyline behind Brooklyn Bridge cables, labeled “Inventory.”
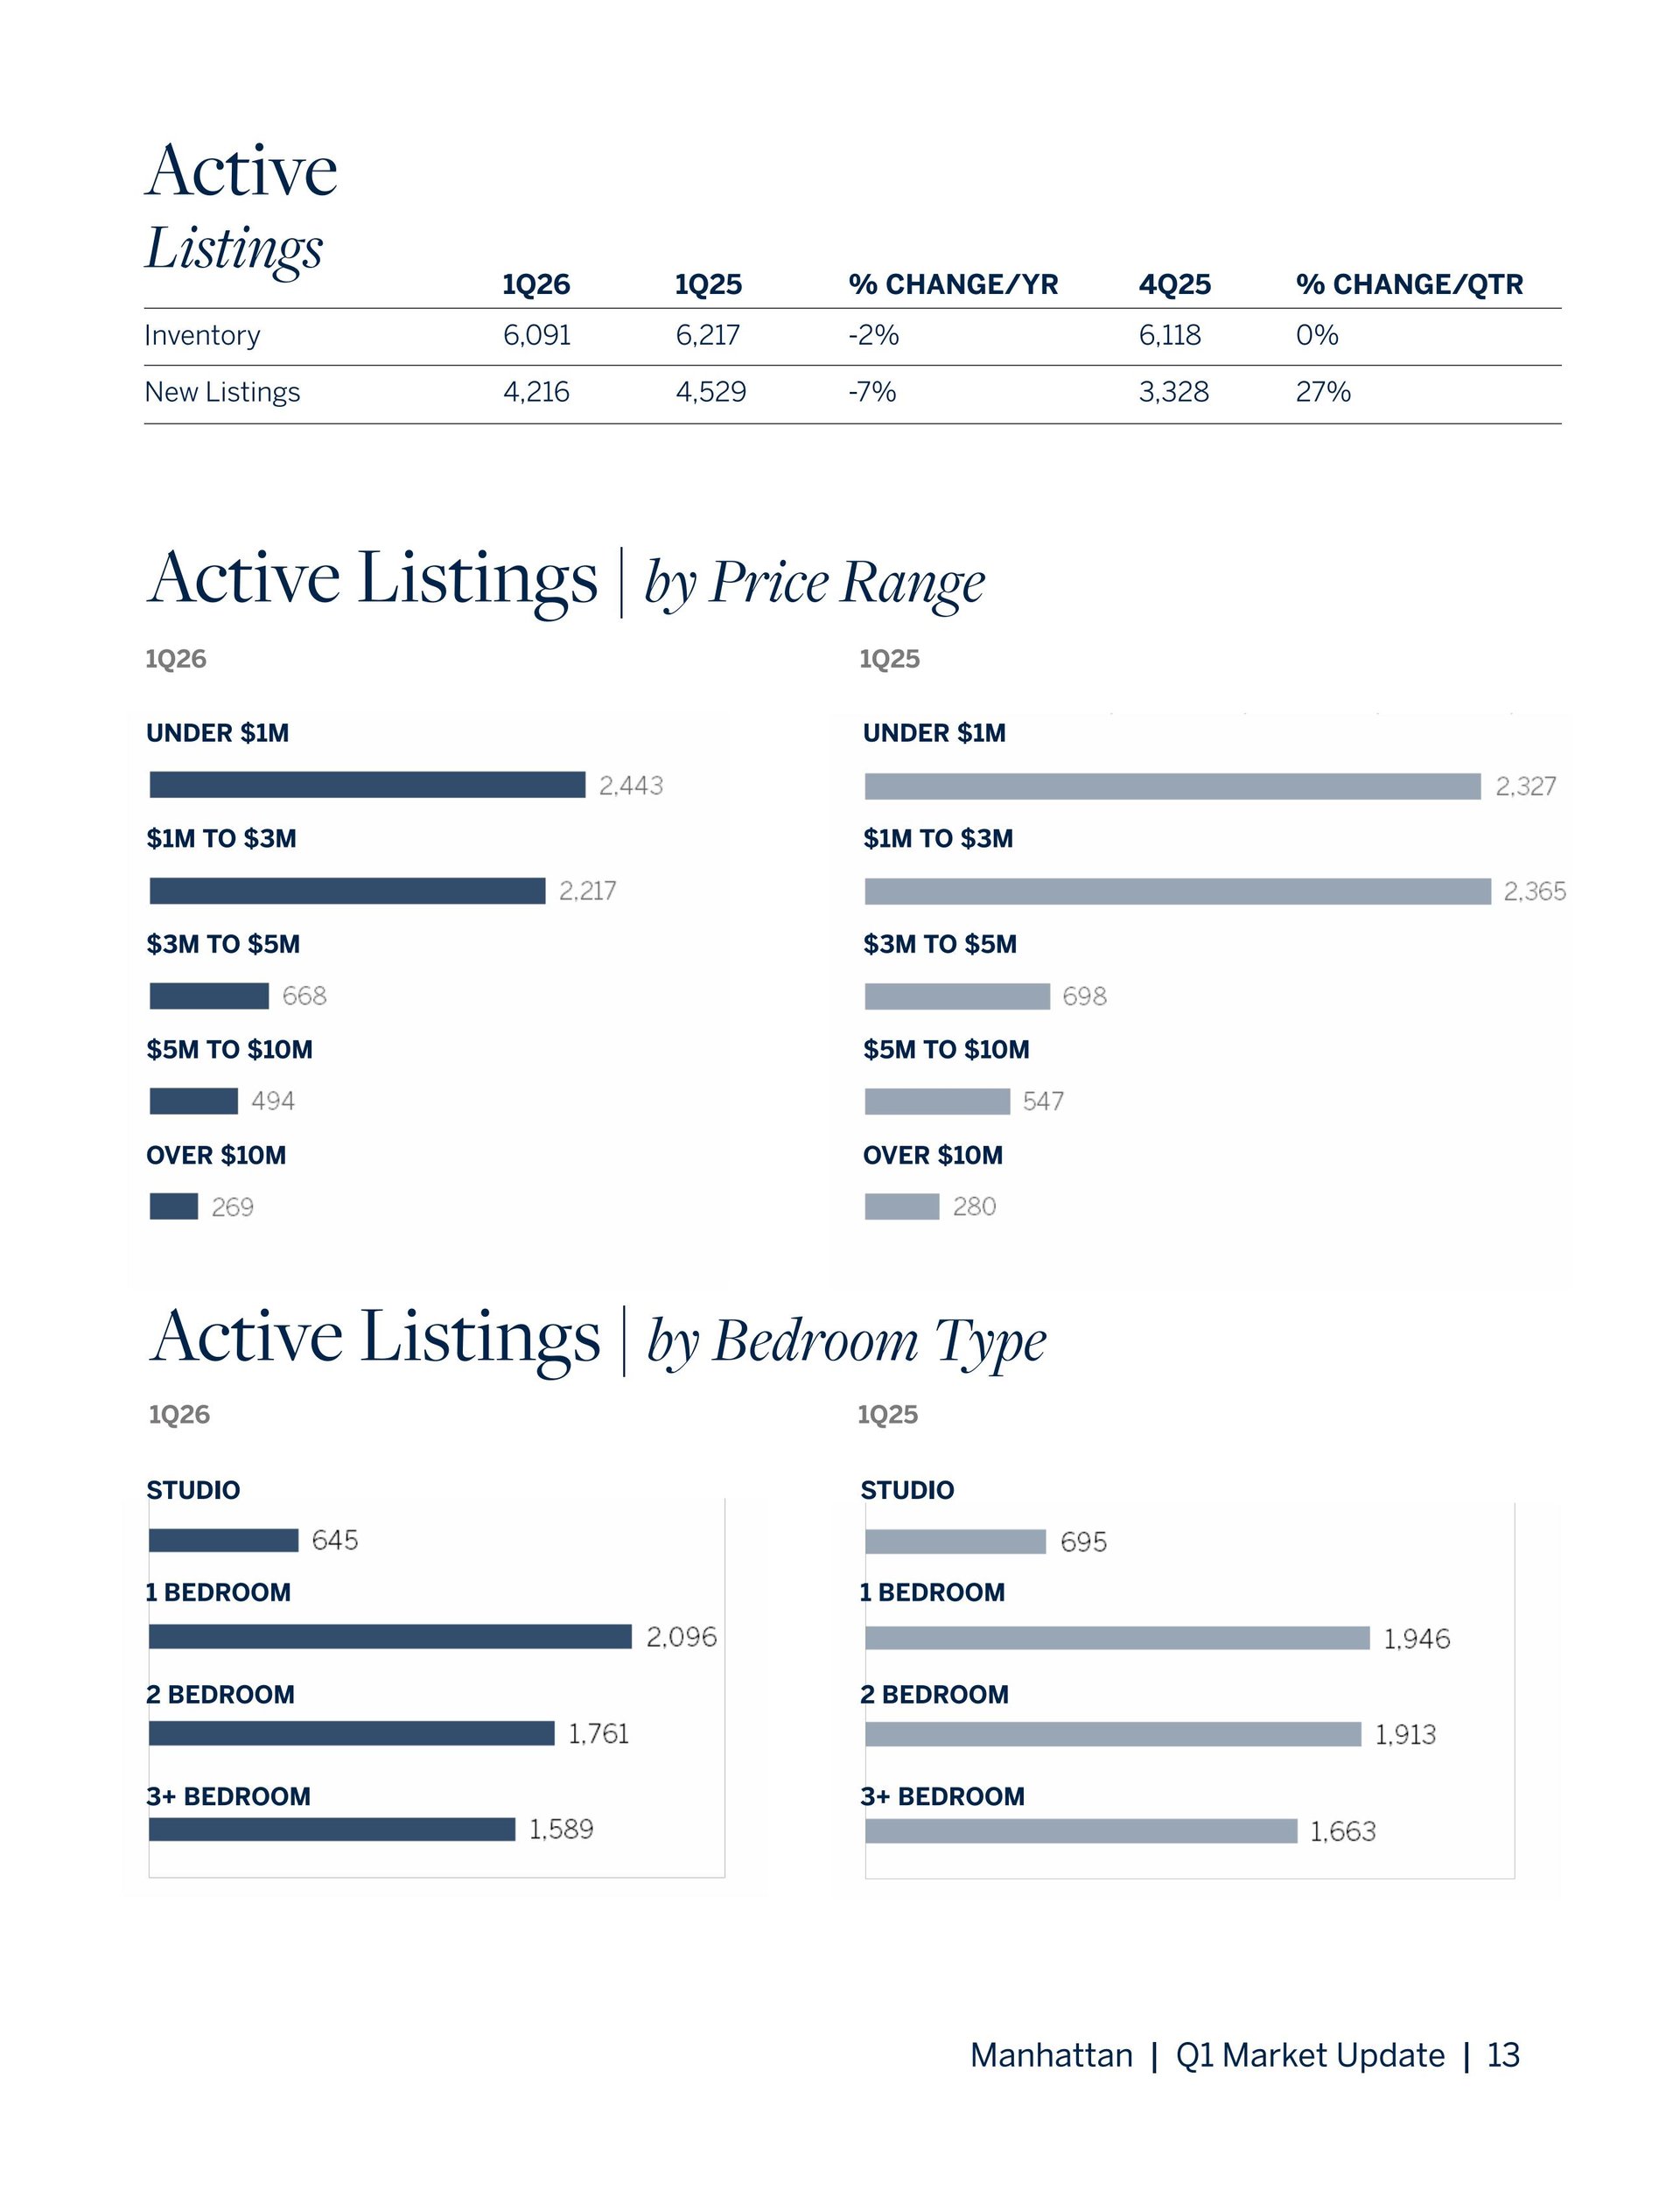
Manhattan Q1 2026 market charts compare active listings by price range and bedroom type with Q1 2025.
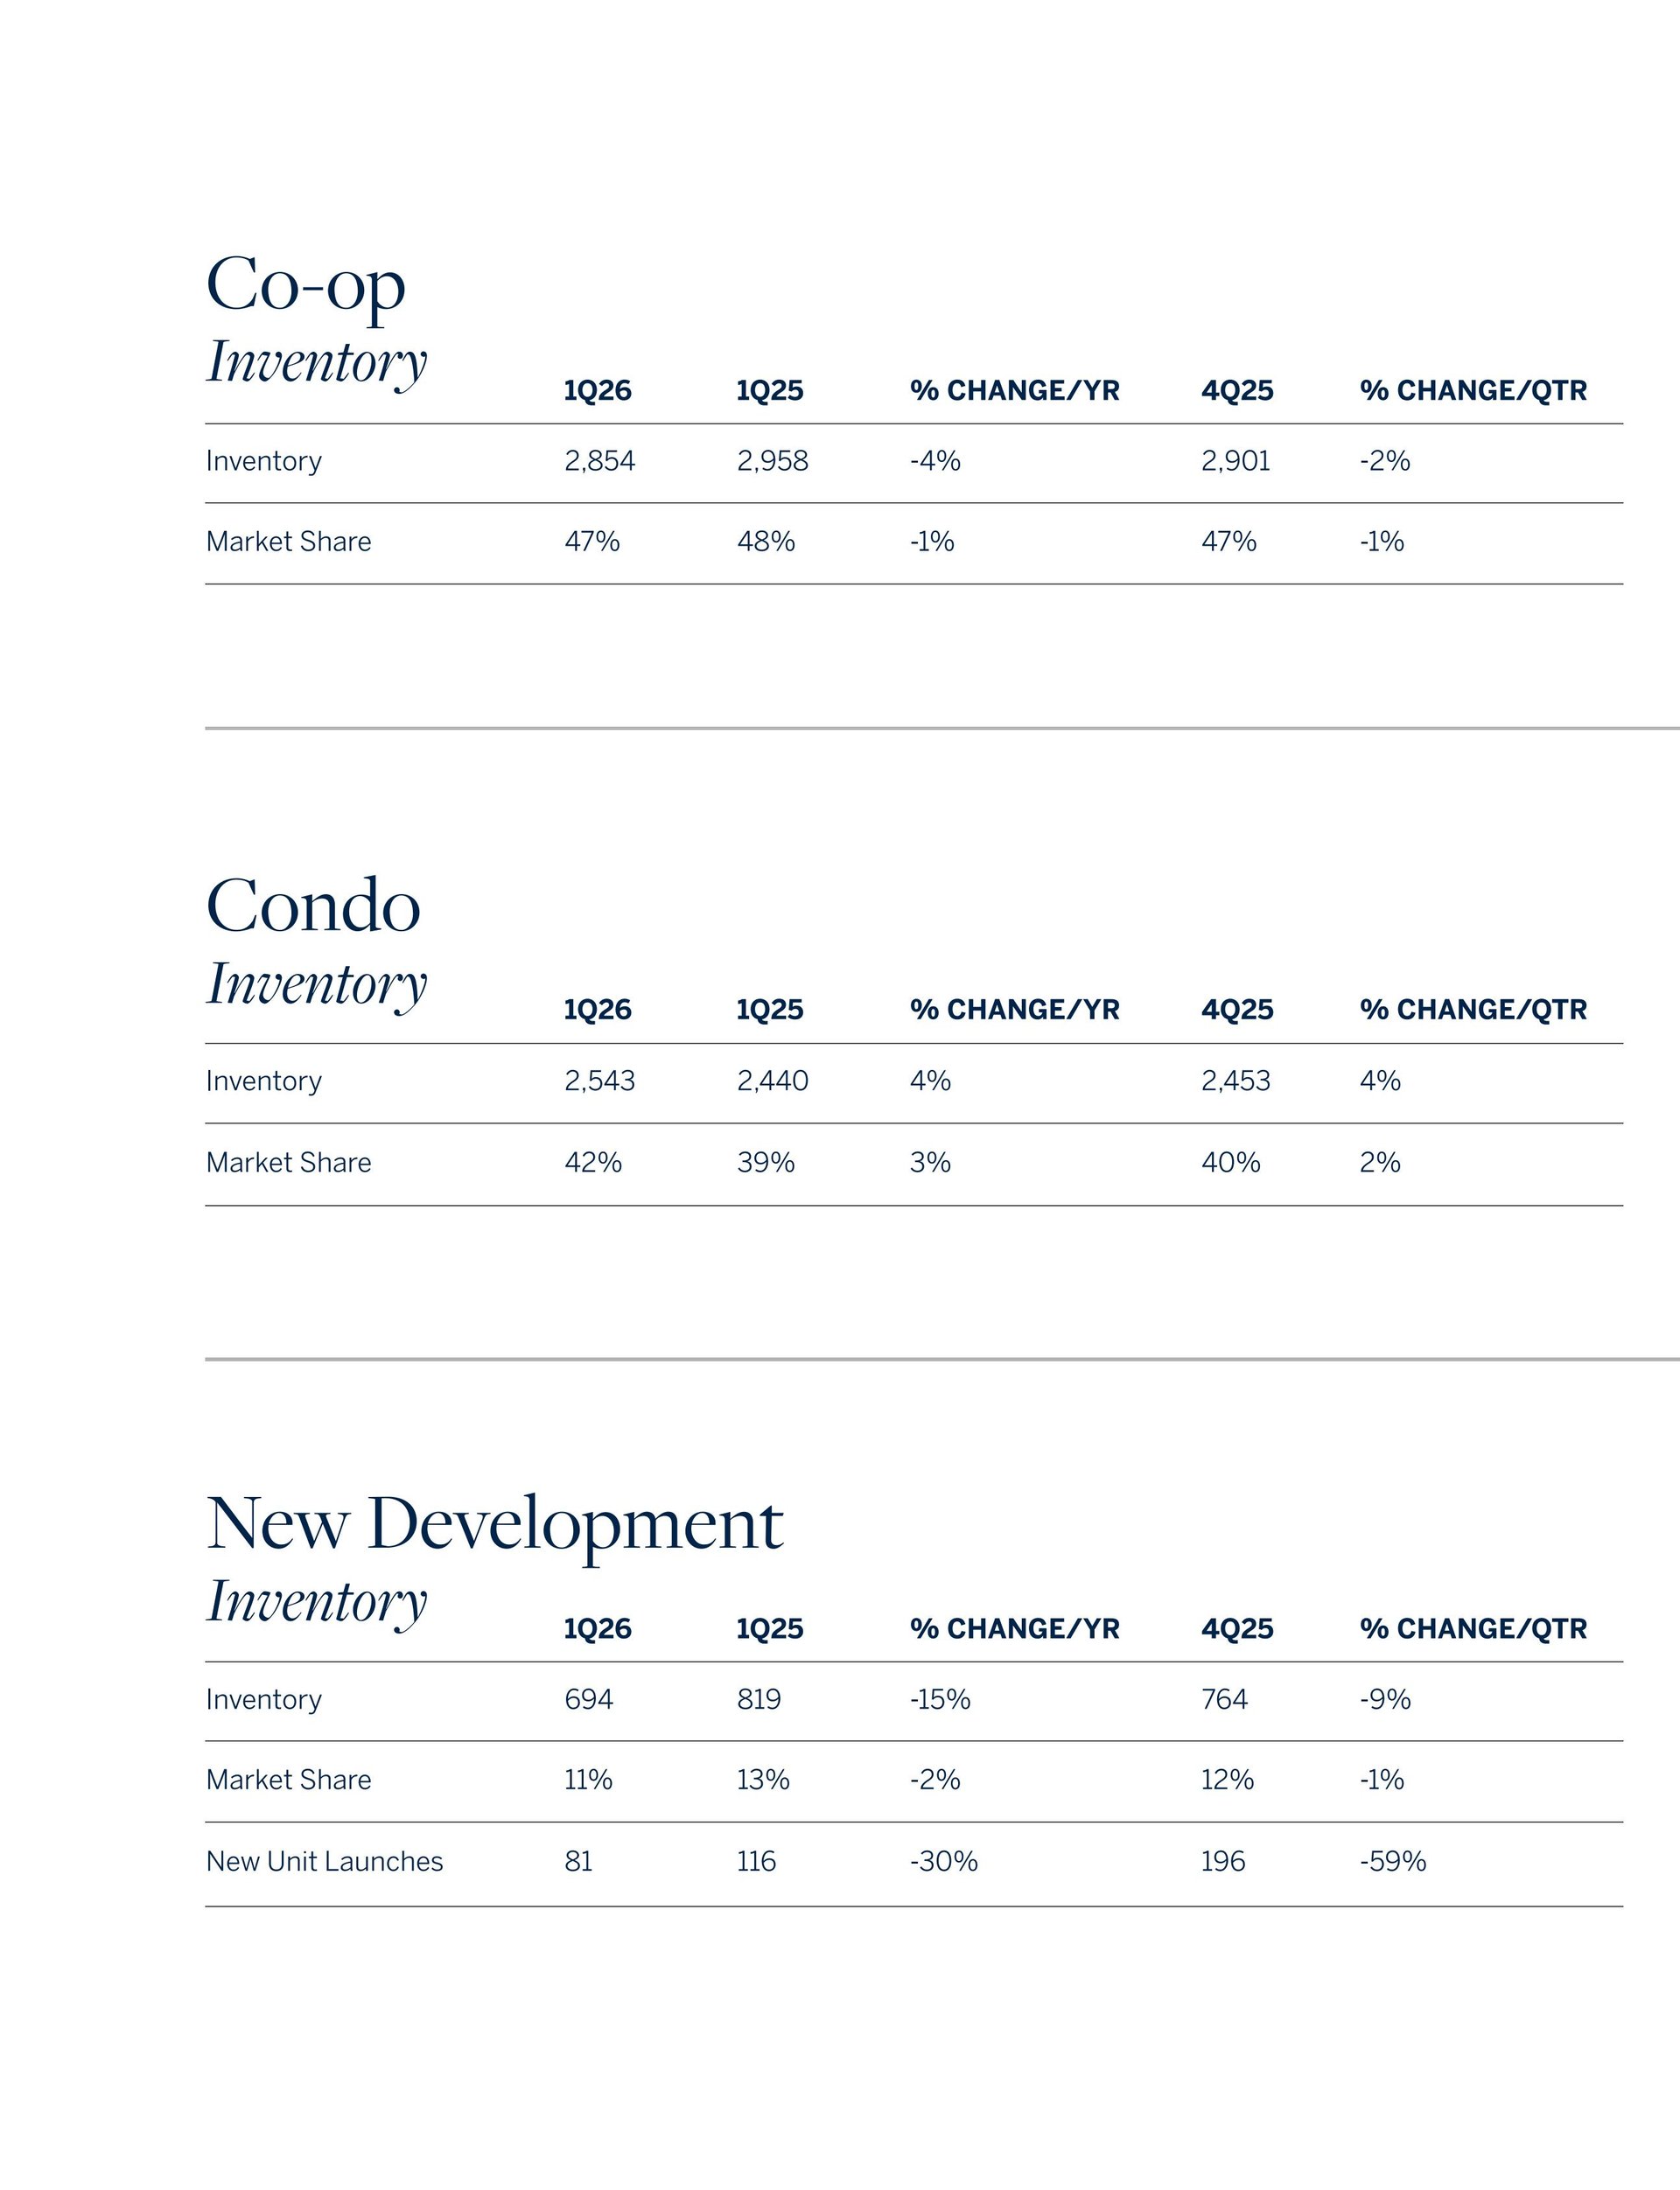
Manhattan Q1 2026 inventory tables for co-ops, condos, and new developments, with year-over-year and quarterly comparisons.
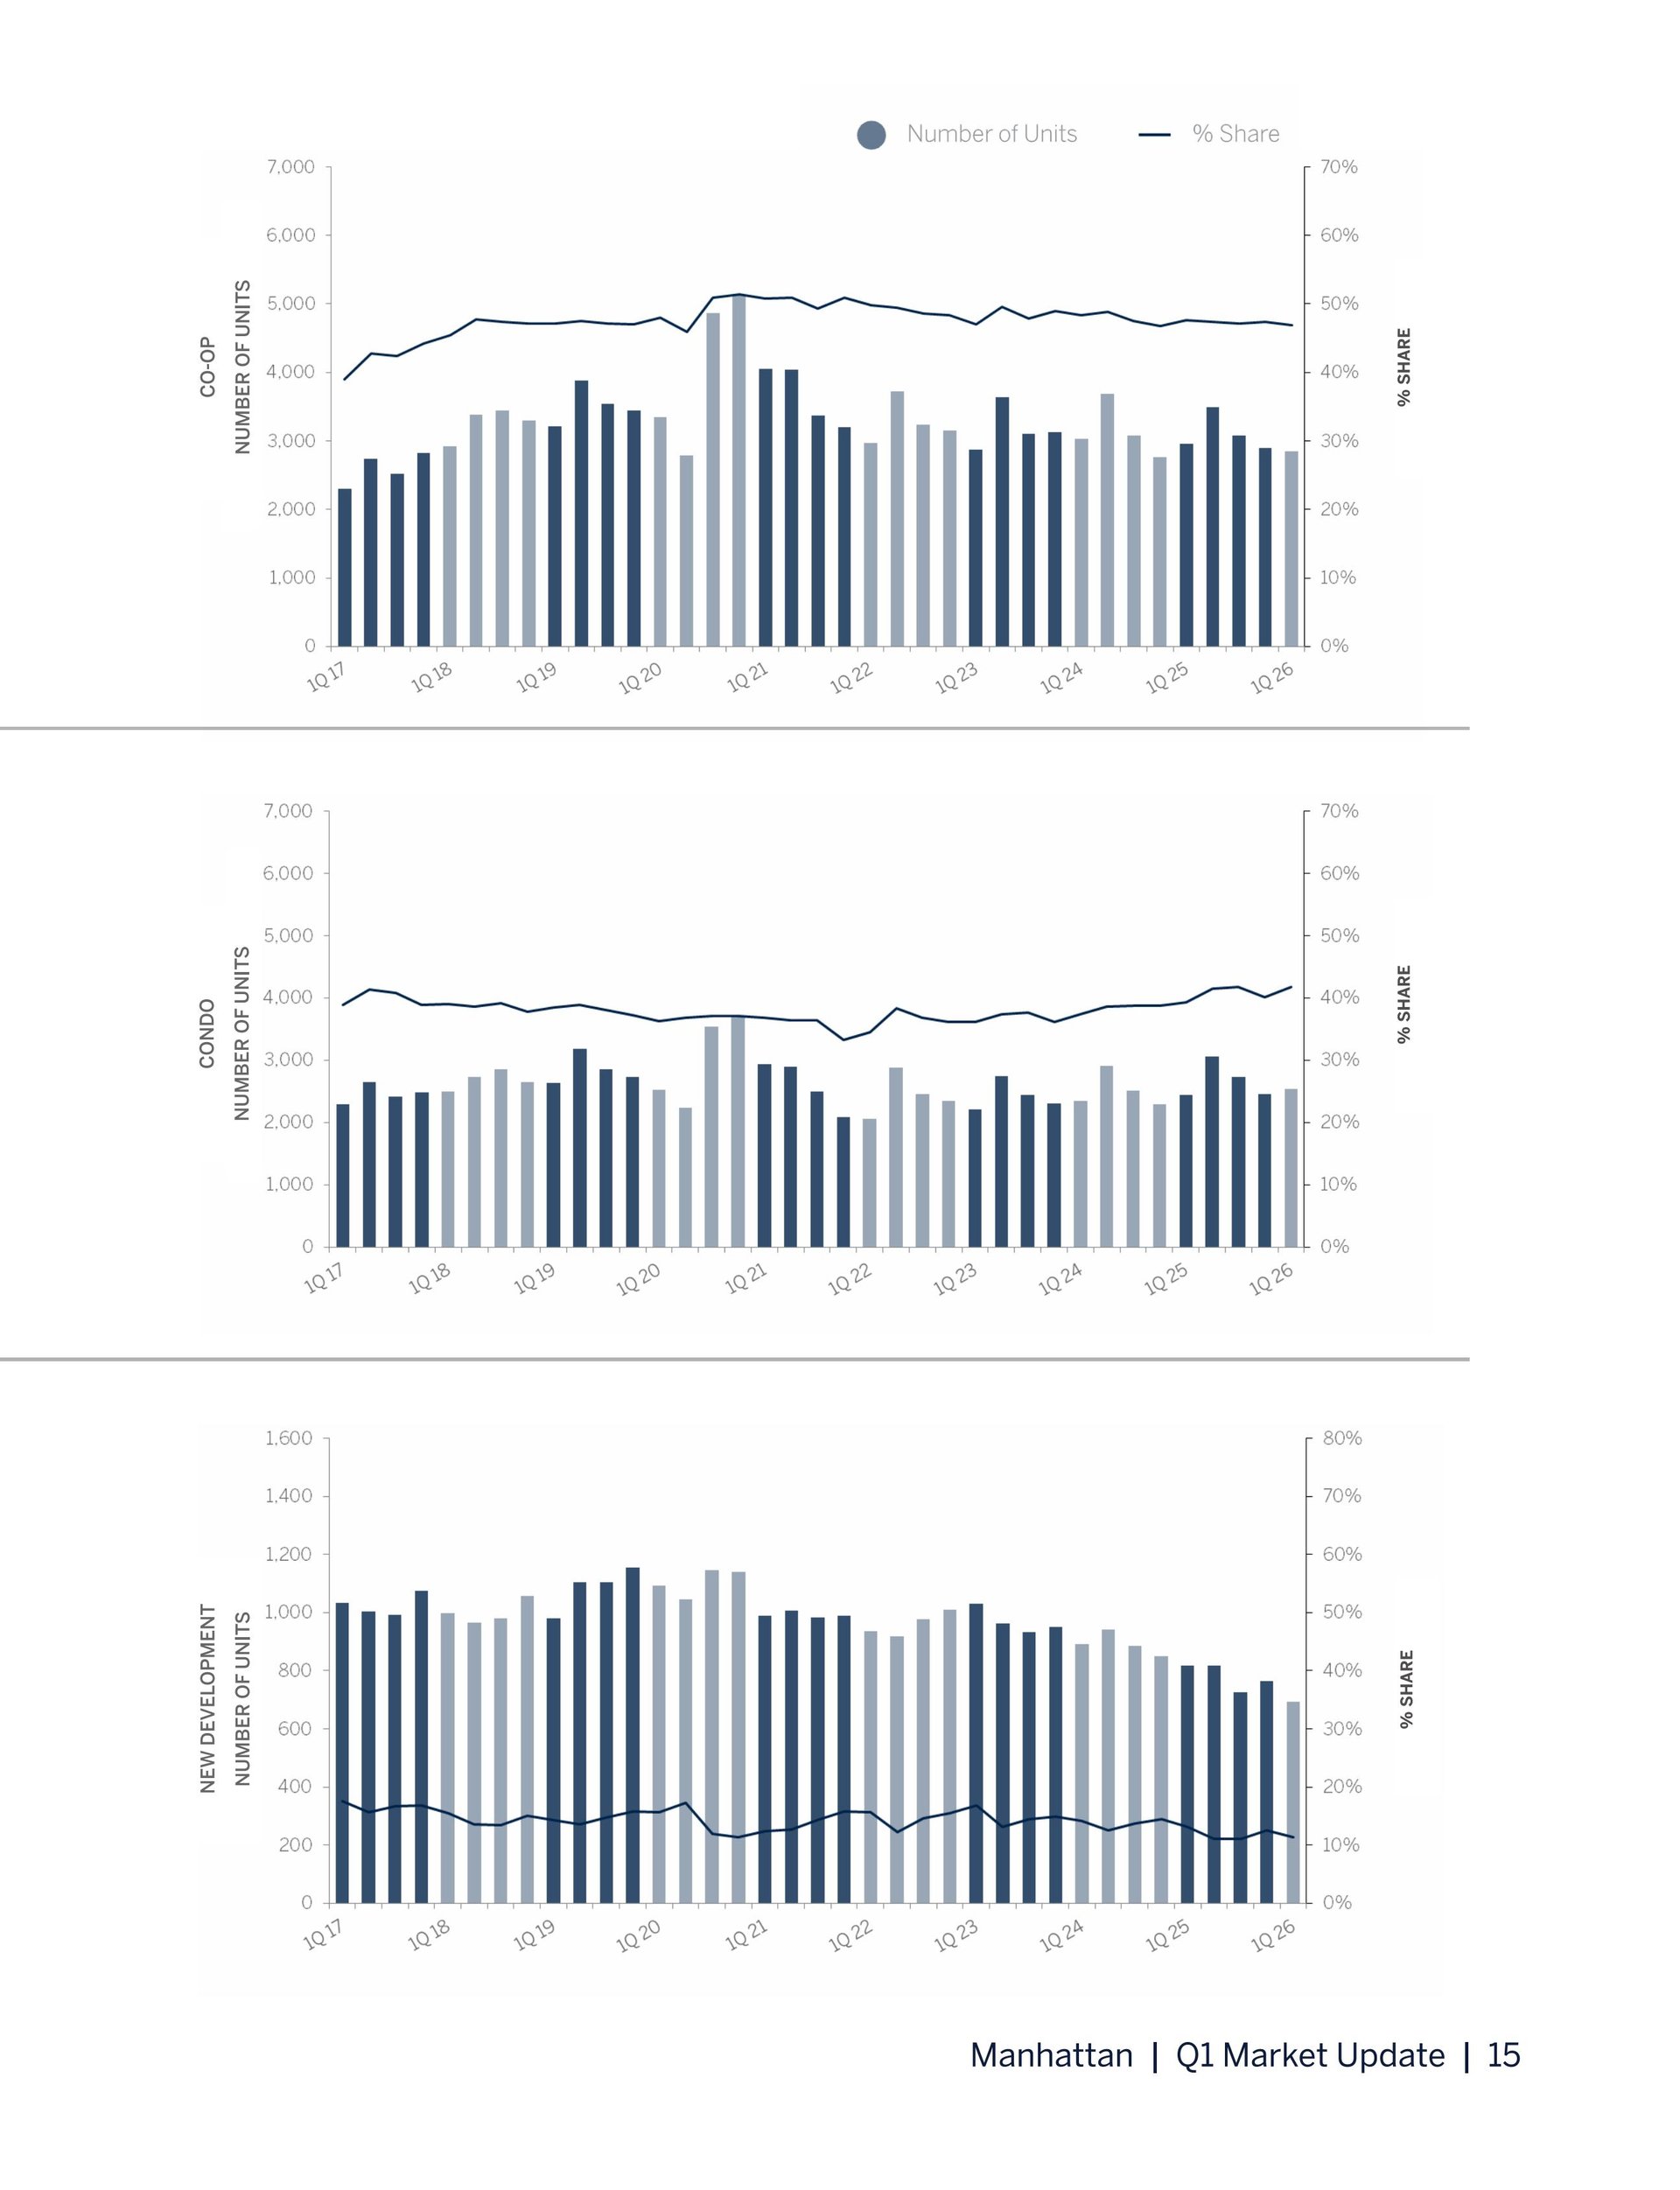
Manhattan quarterly charts compare co-op, condo, and new-development unit counts with percentage shares.
Prices section graphic featuring the Flatiron Building.
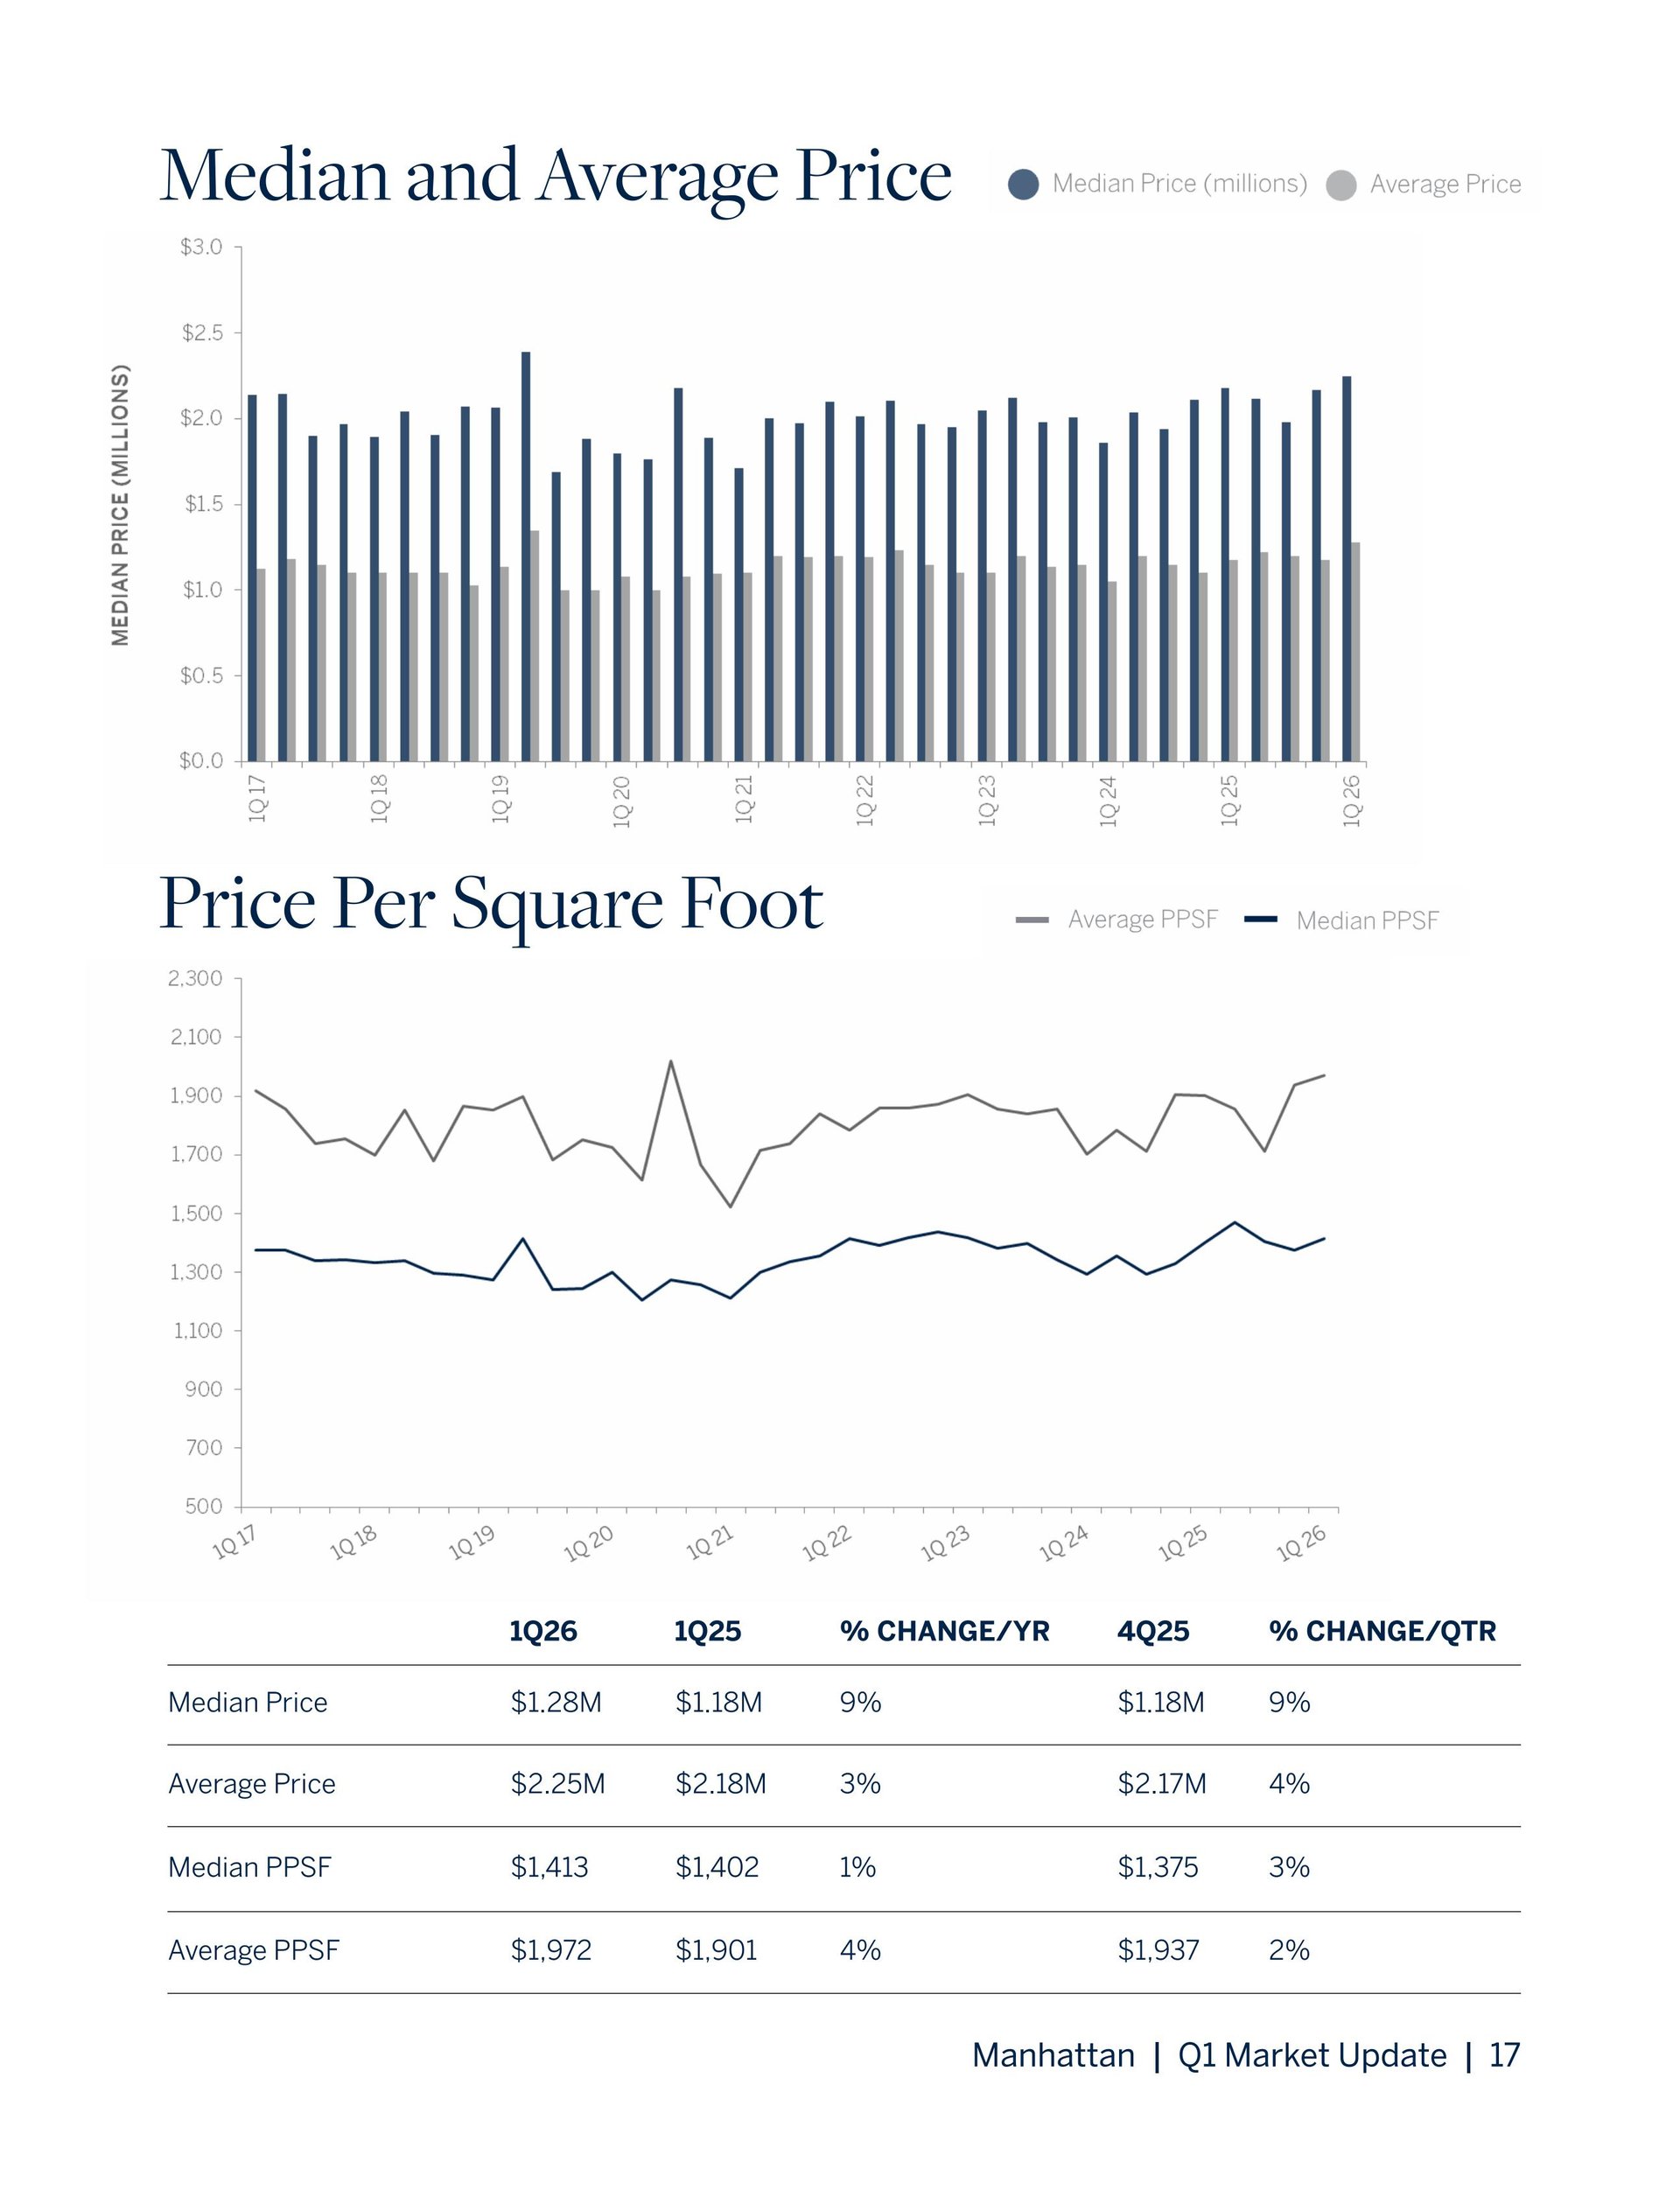
Manhattan Q1 2026 report charts showing prices and price per square foot.
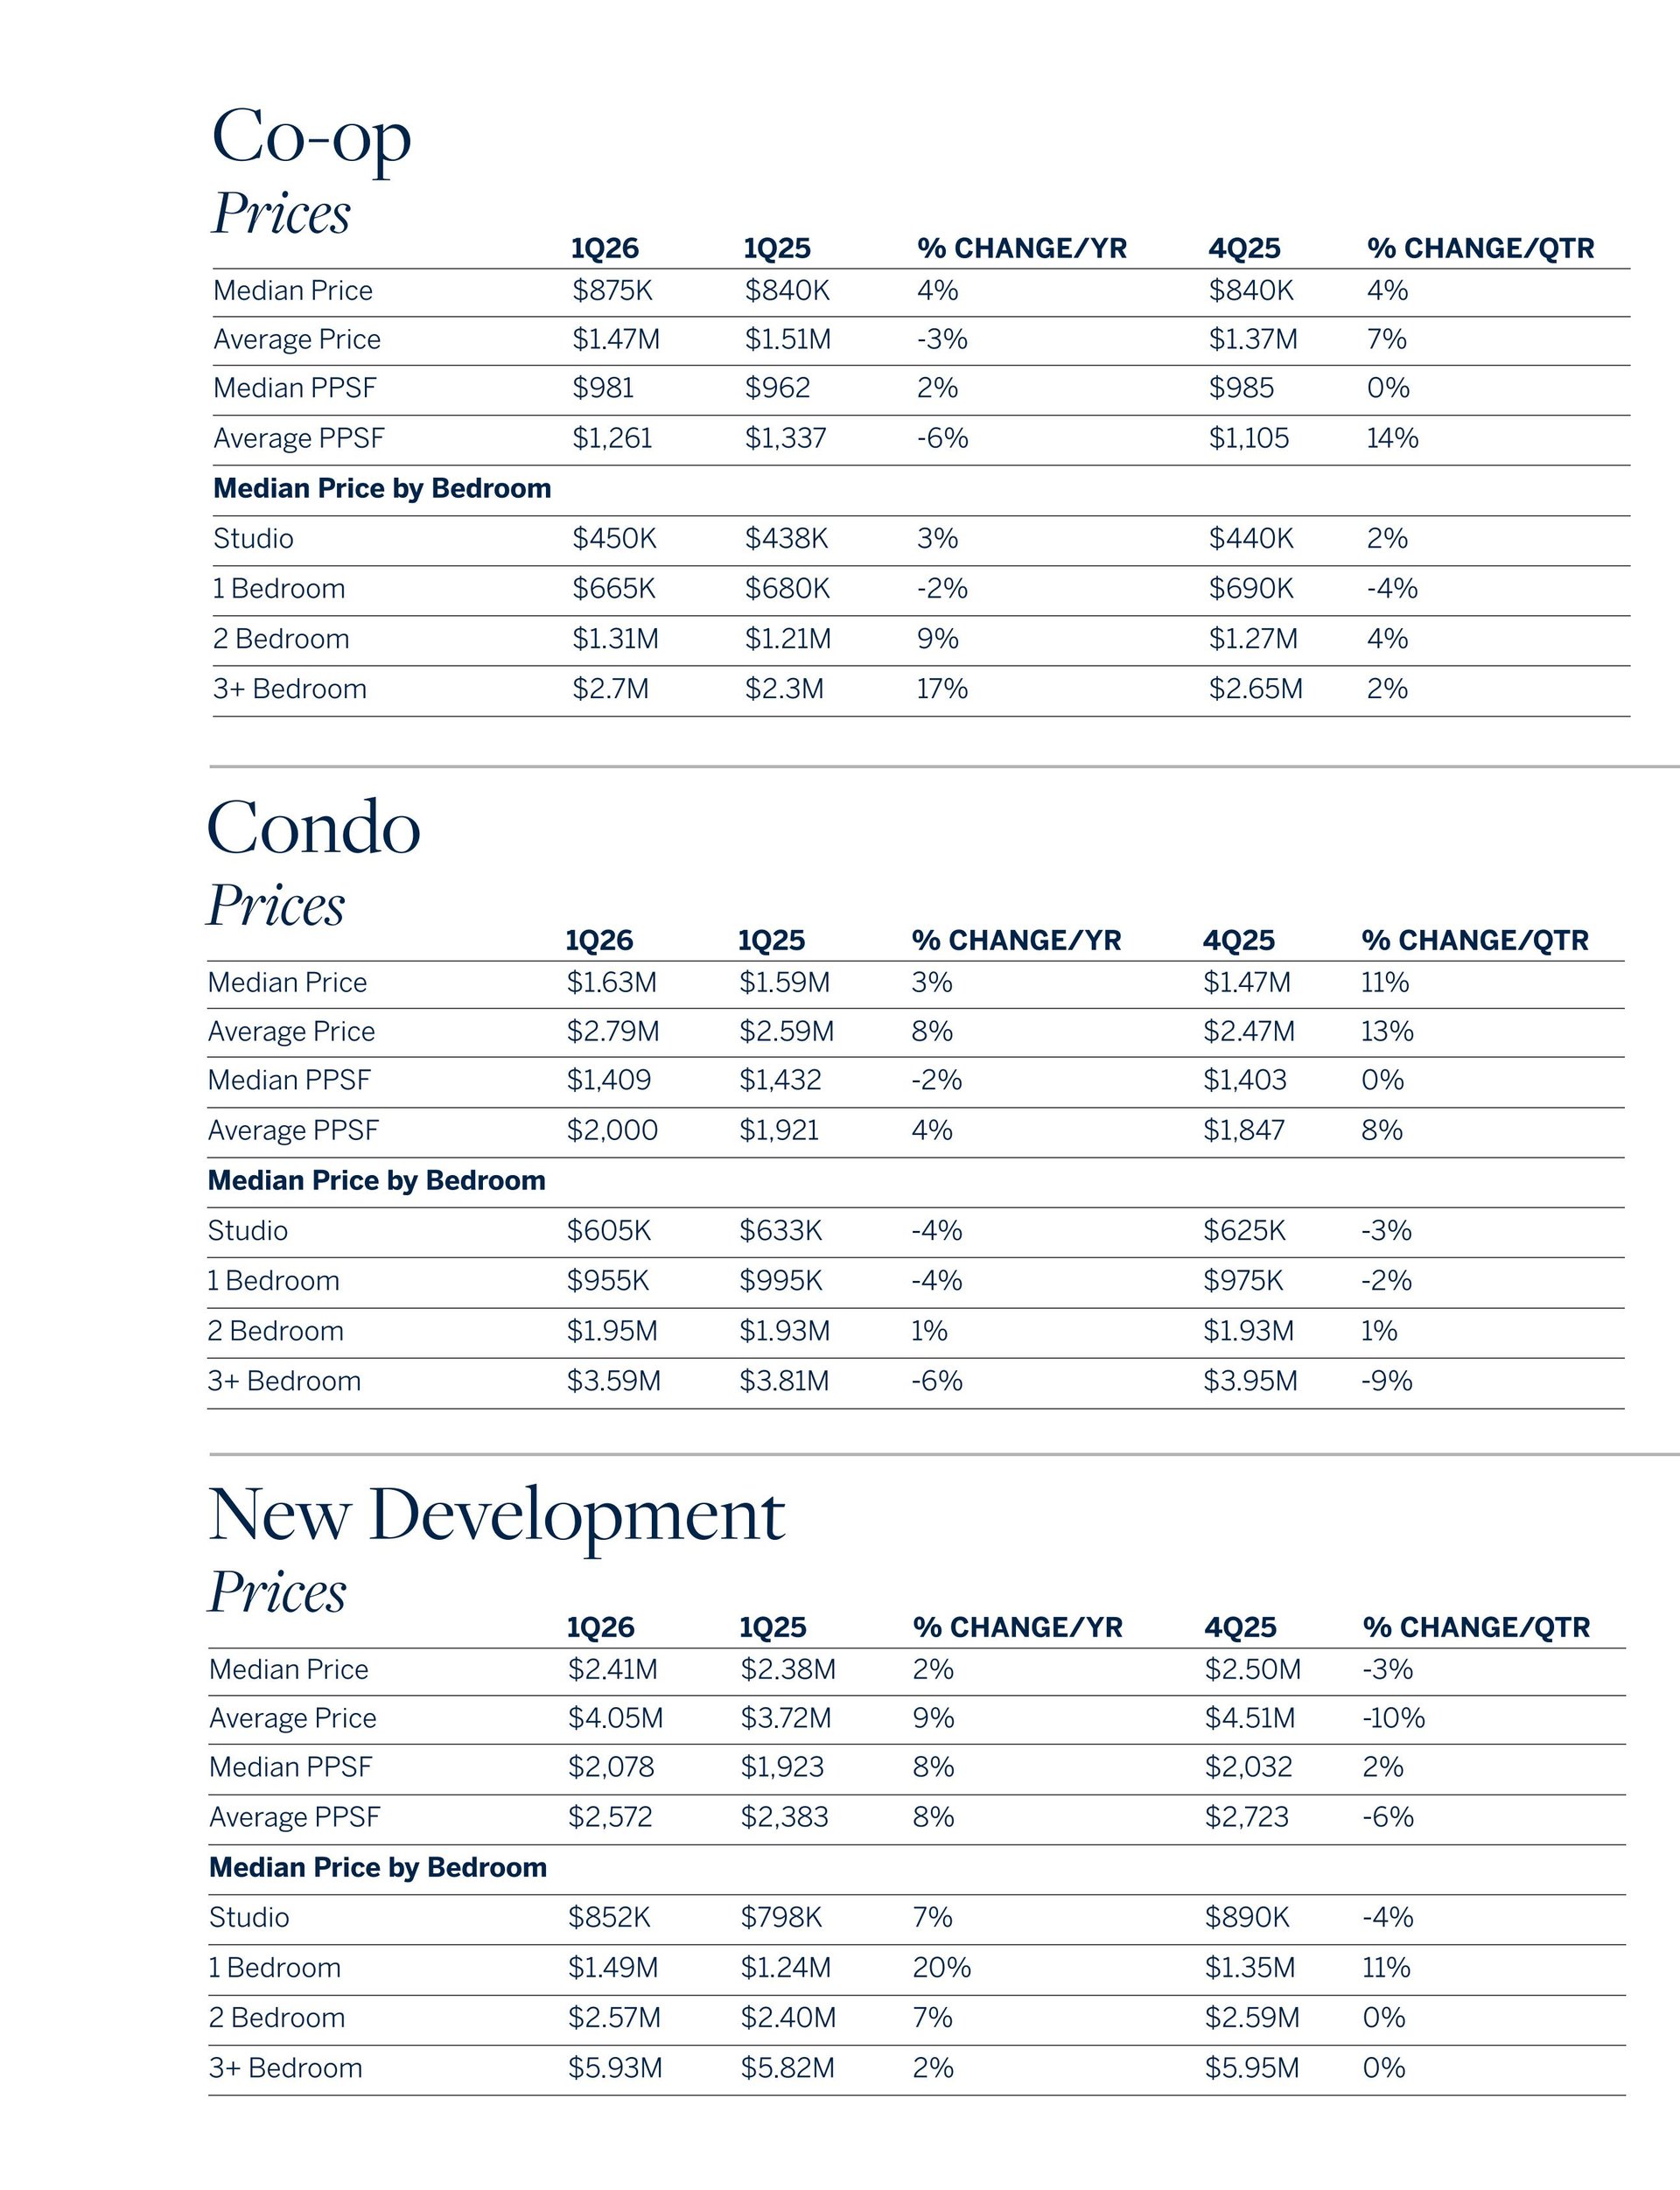
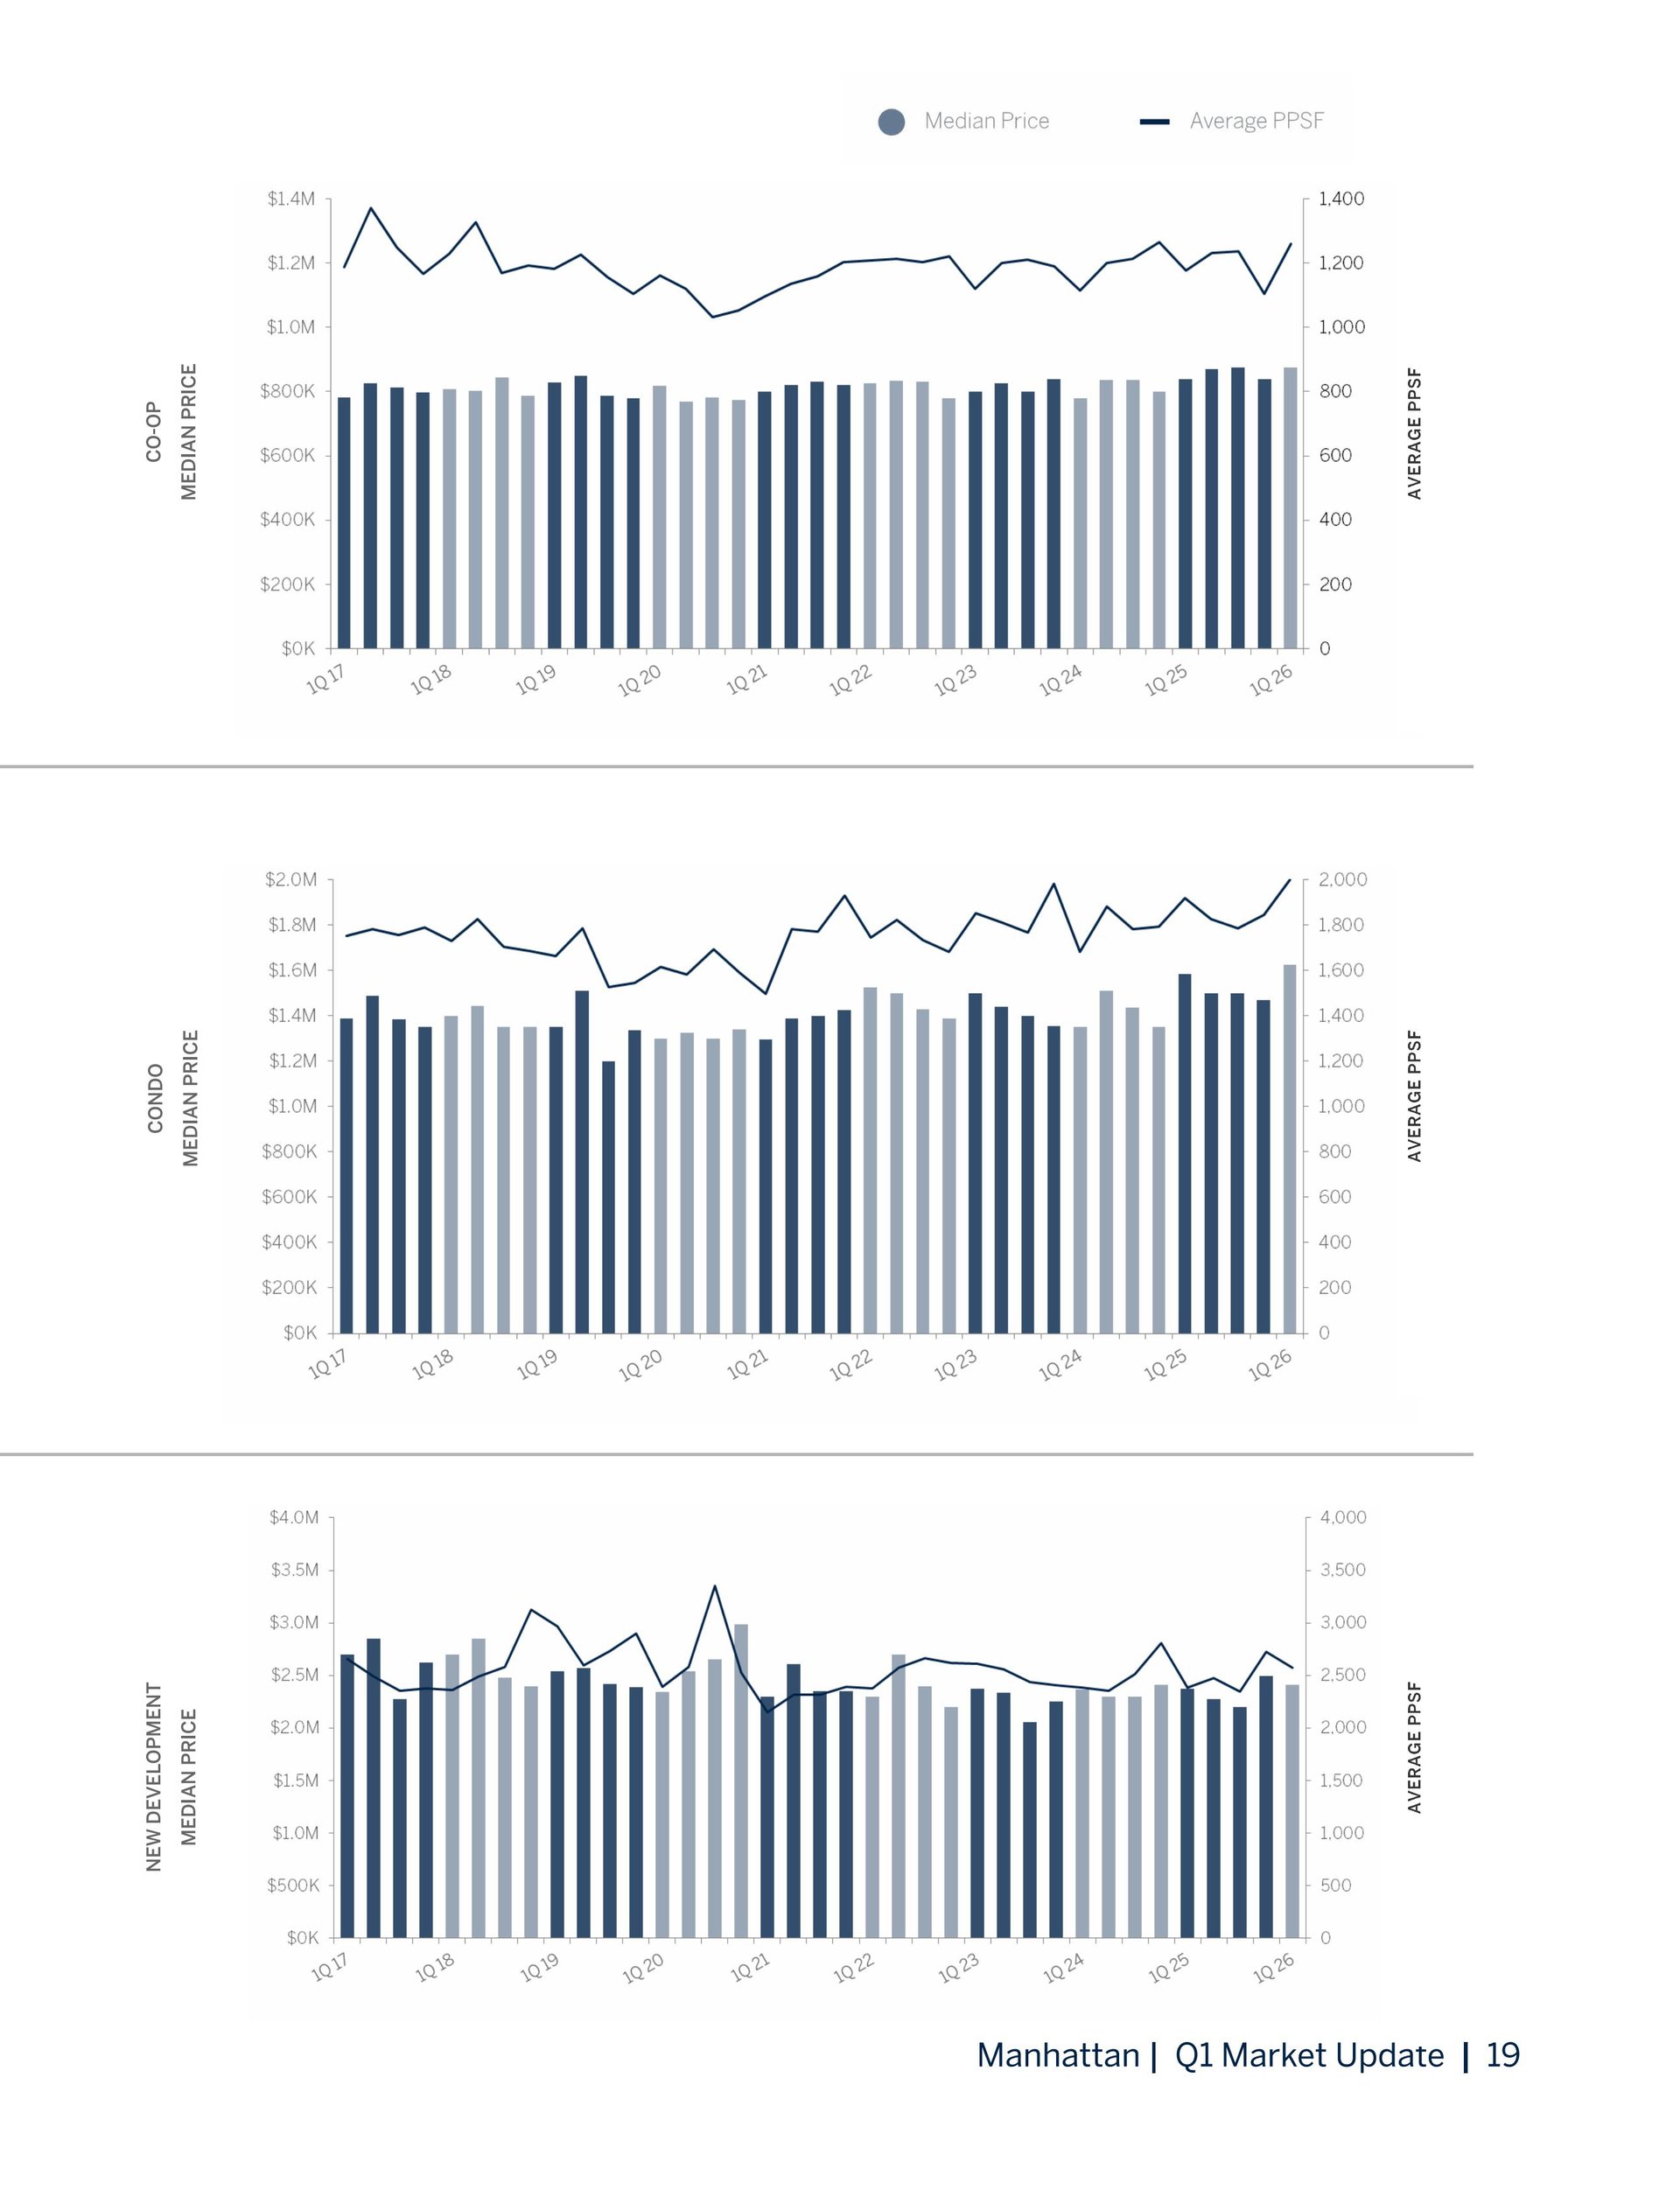
Manhattan Q1 2026 price tables comparing co-ops, condos, and new developments by year, quarter, and bedroom count. Manhattan quarterly market chart comparing median prices and average price per square foot for co-ops, condos, and new developments.
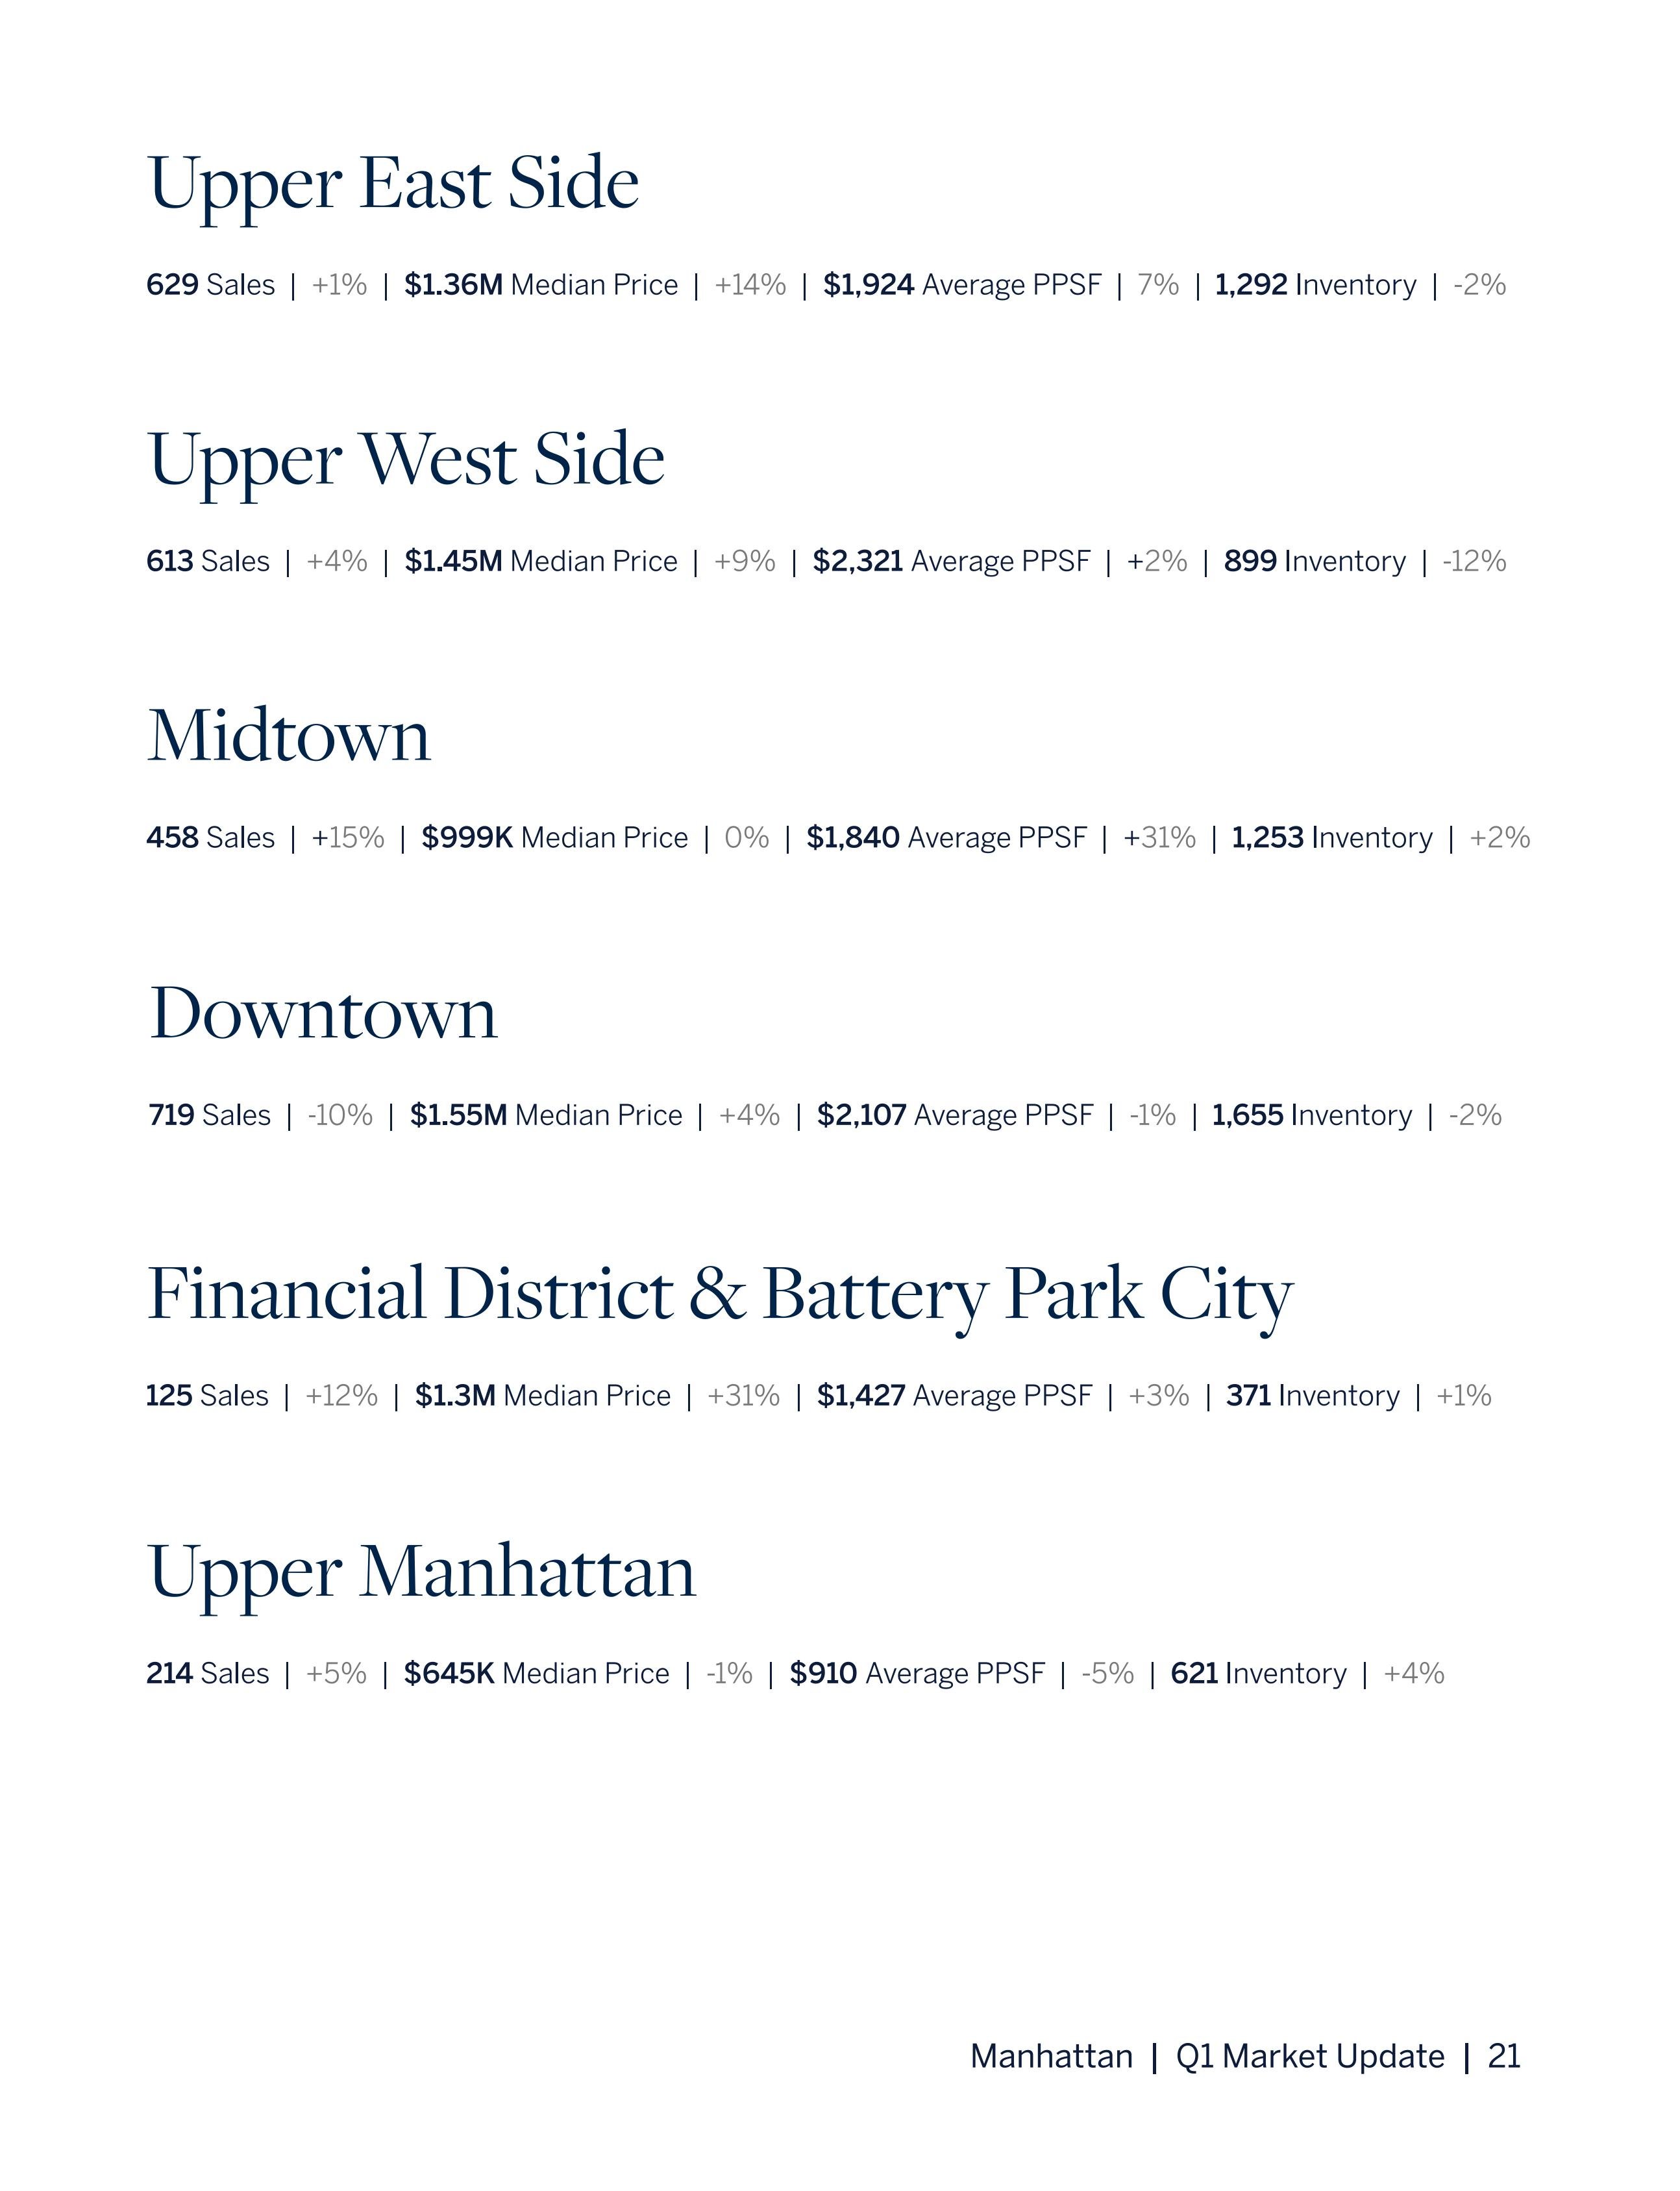
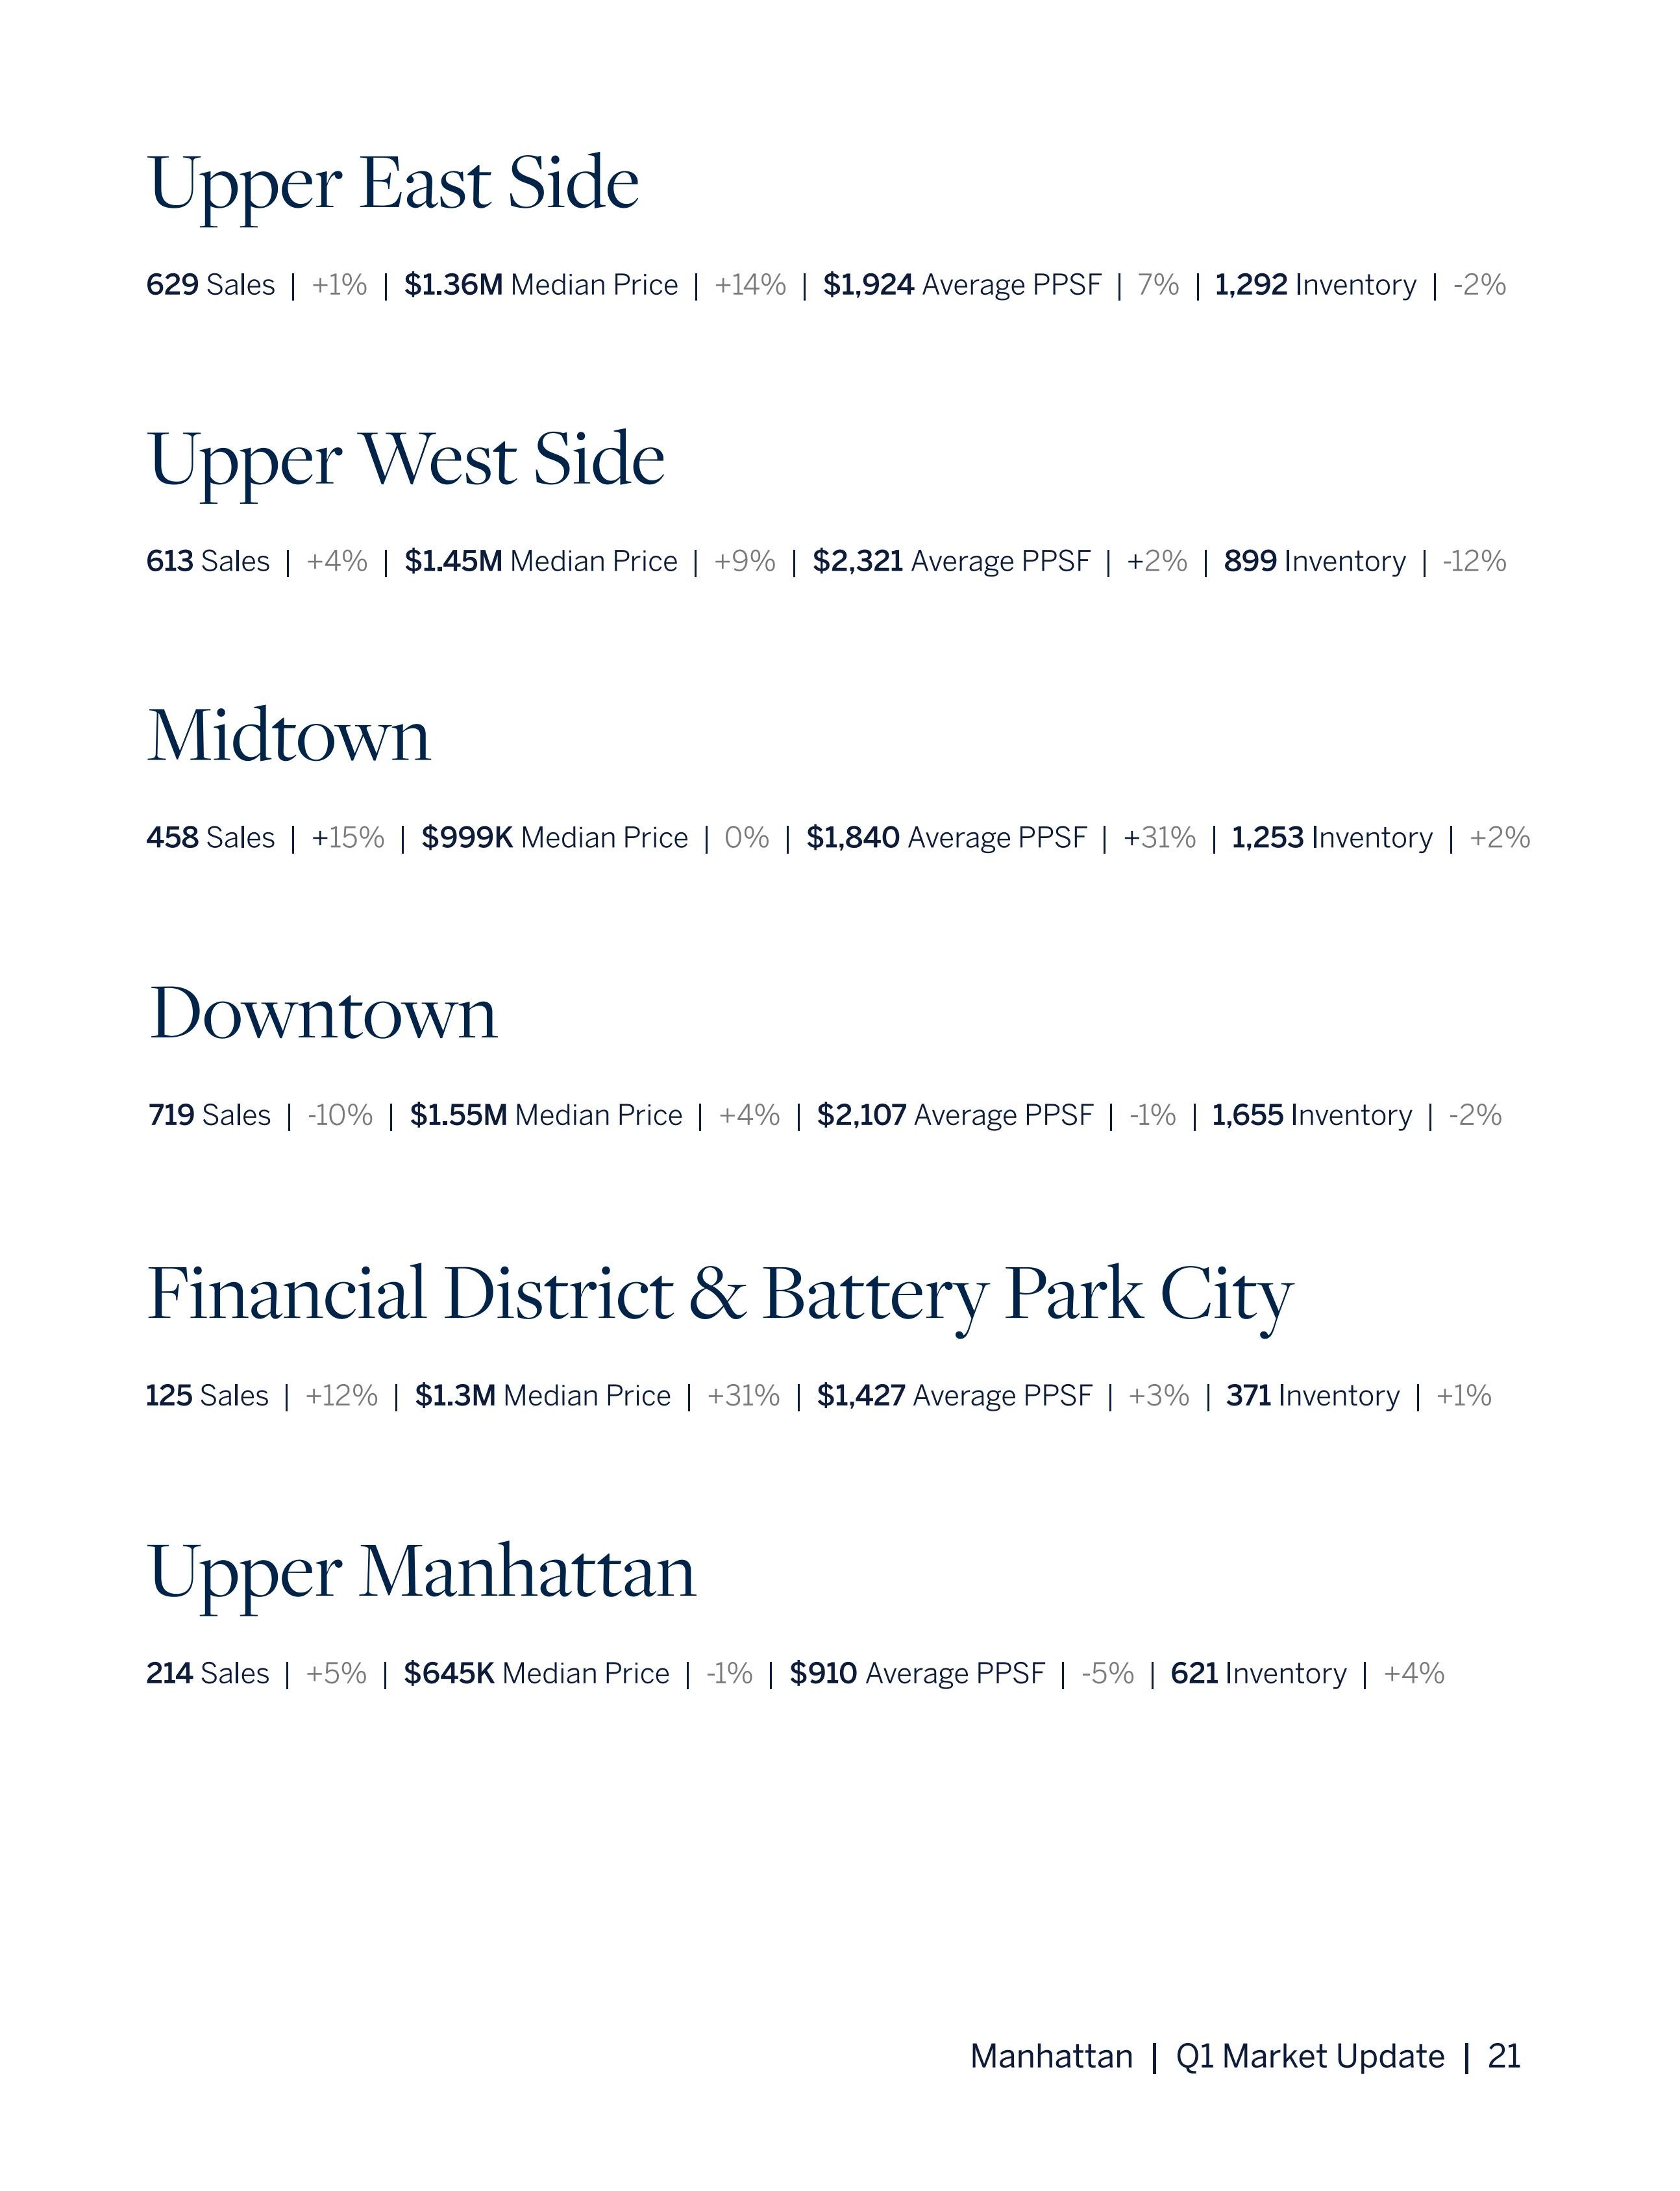
Neighborhood Highlights over a photograph of brownstones and ornate iron stoop railings. Manhattan Q1 market update with neighborhood sales, median prices, average price per square foot, and inventory statistics.
Upper East Side apartment living area with floor-to-ceiling windows overlooking Manhattan.
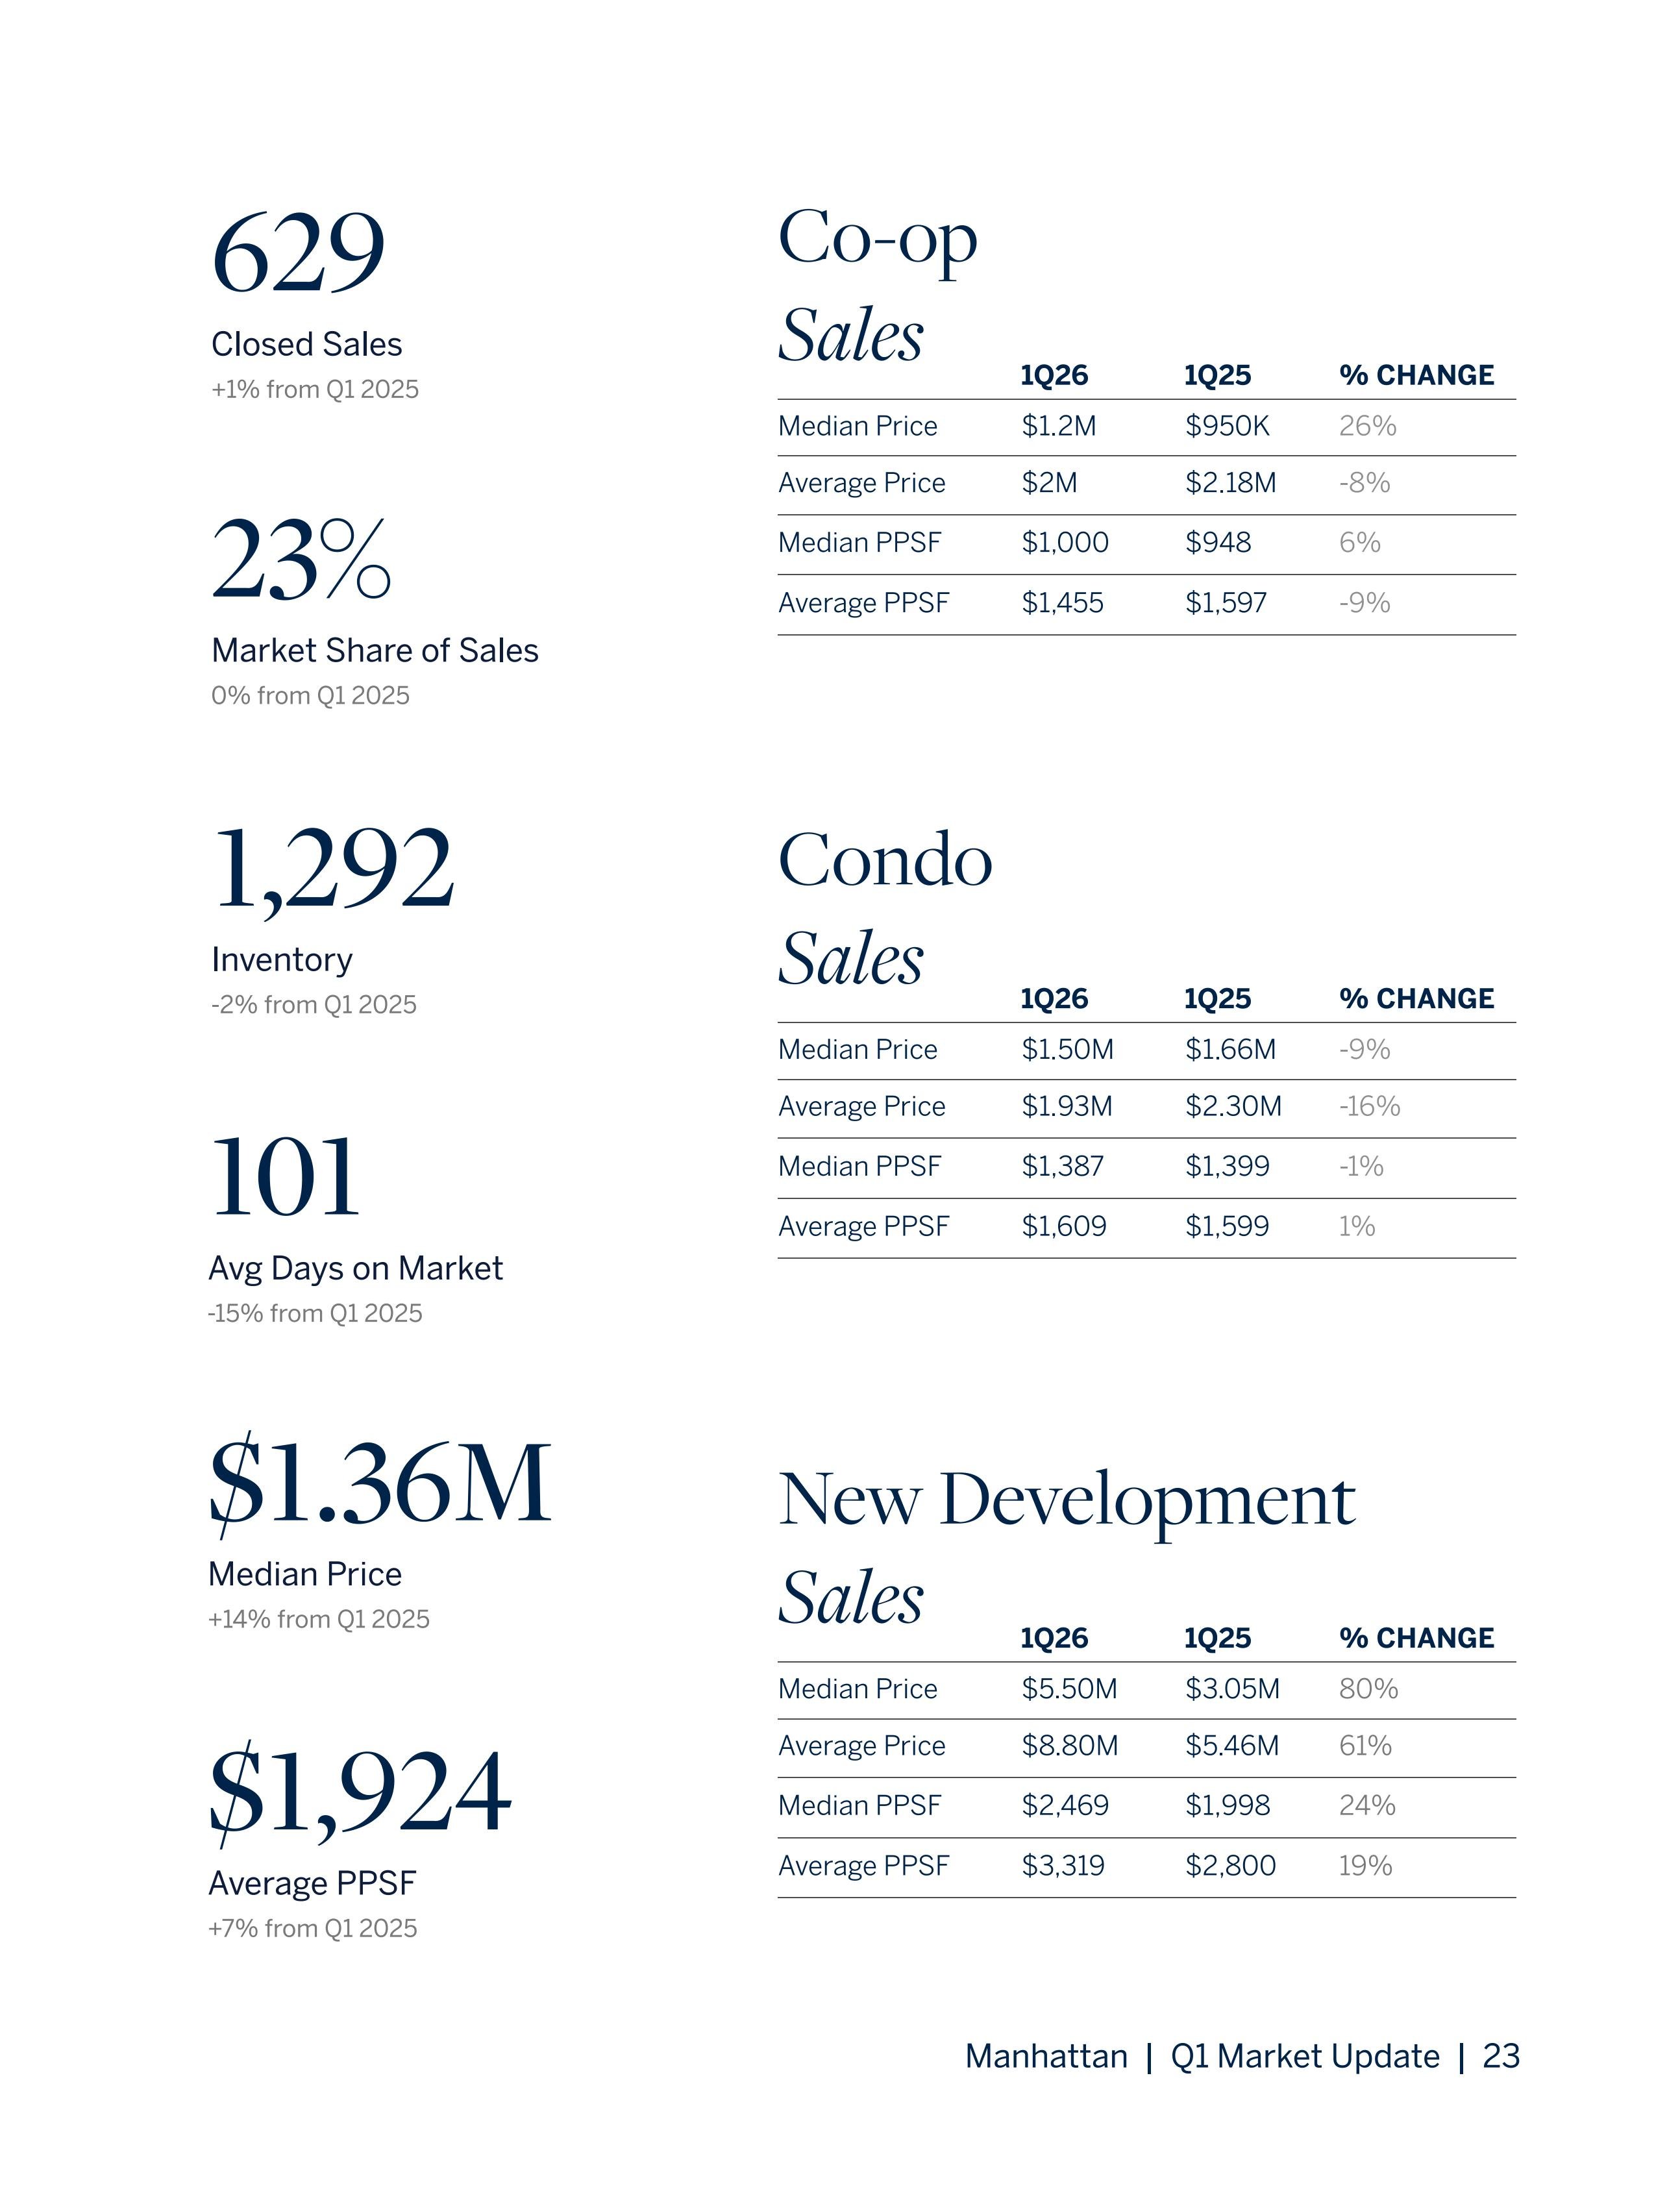
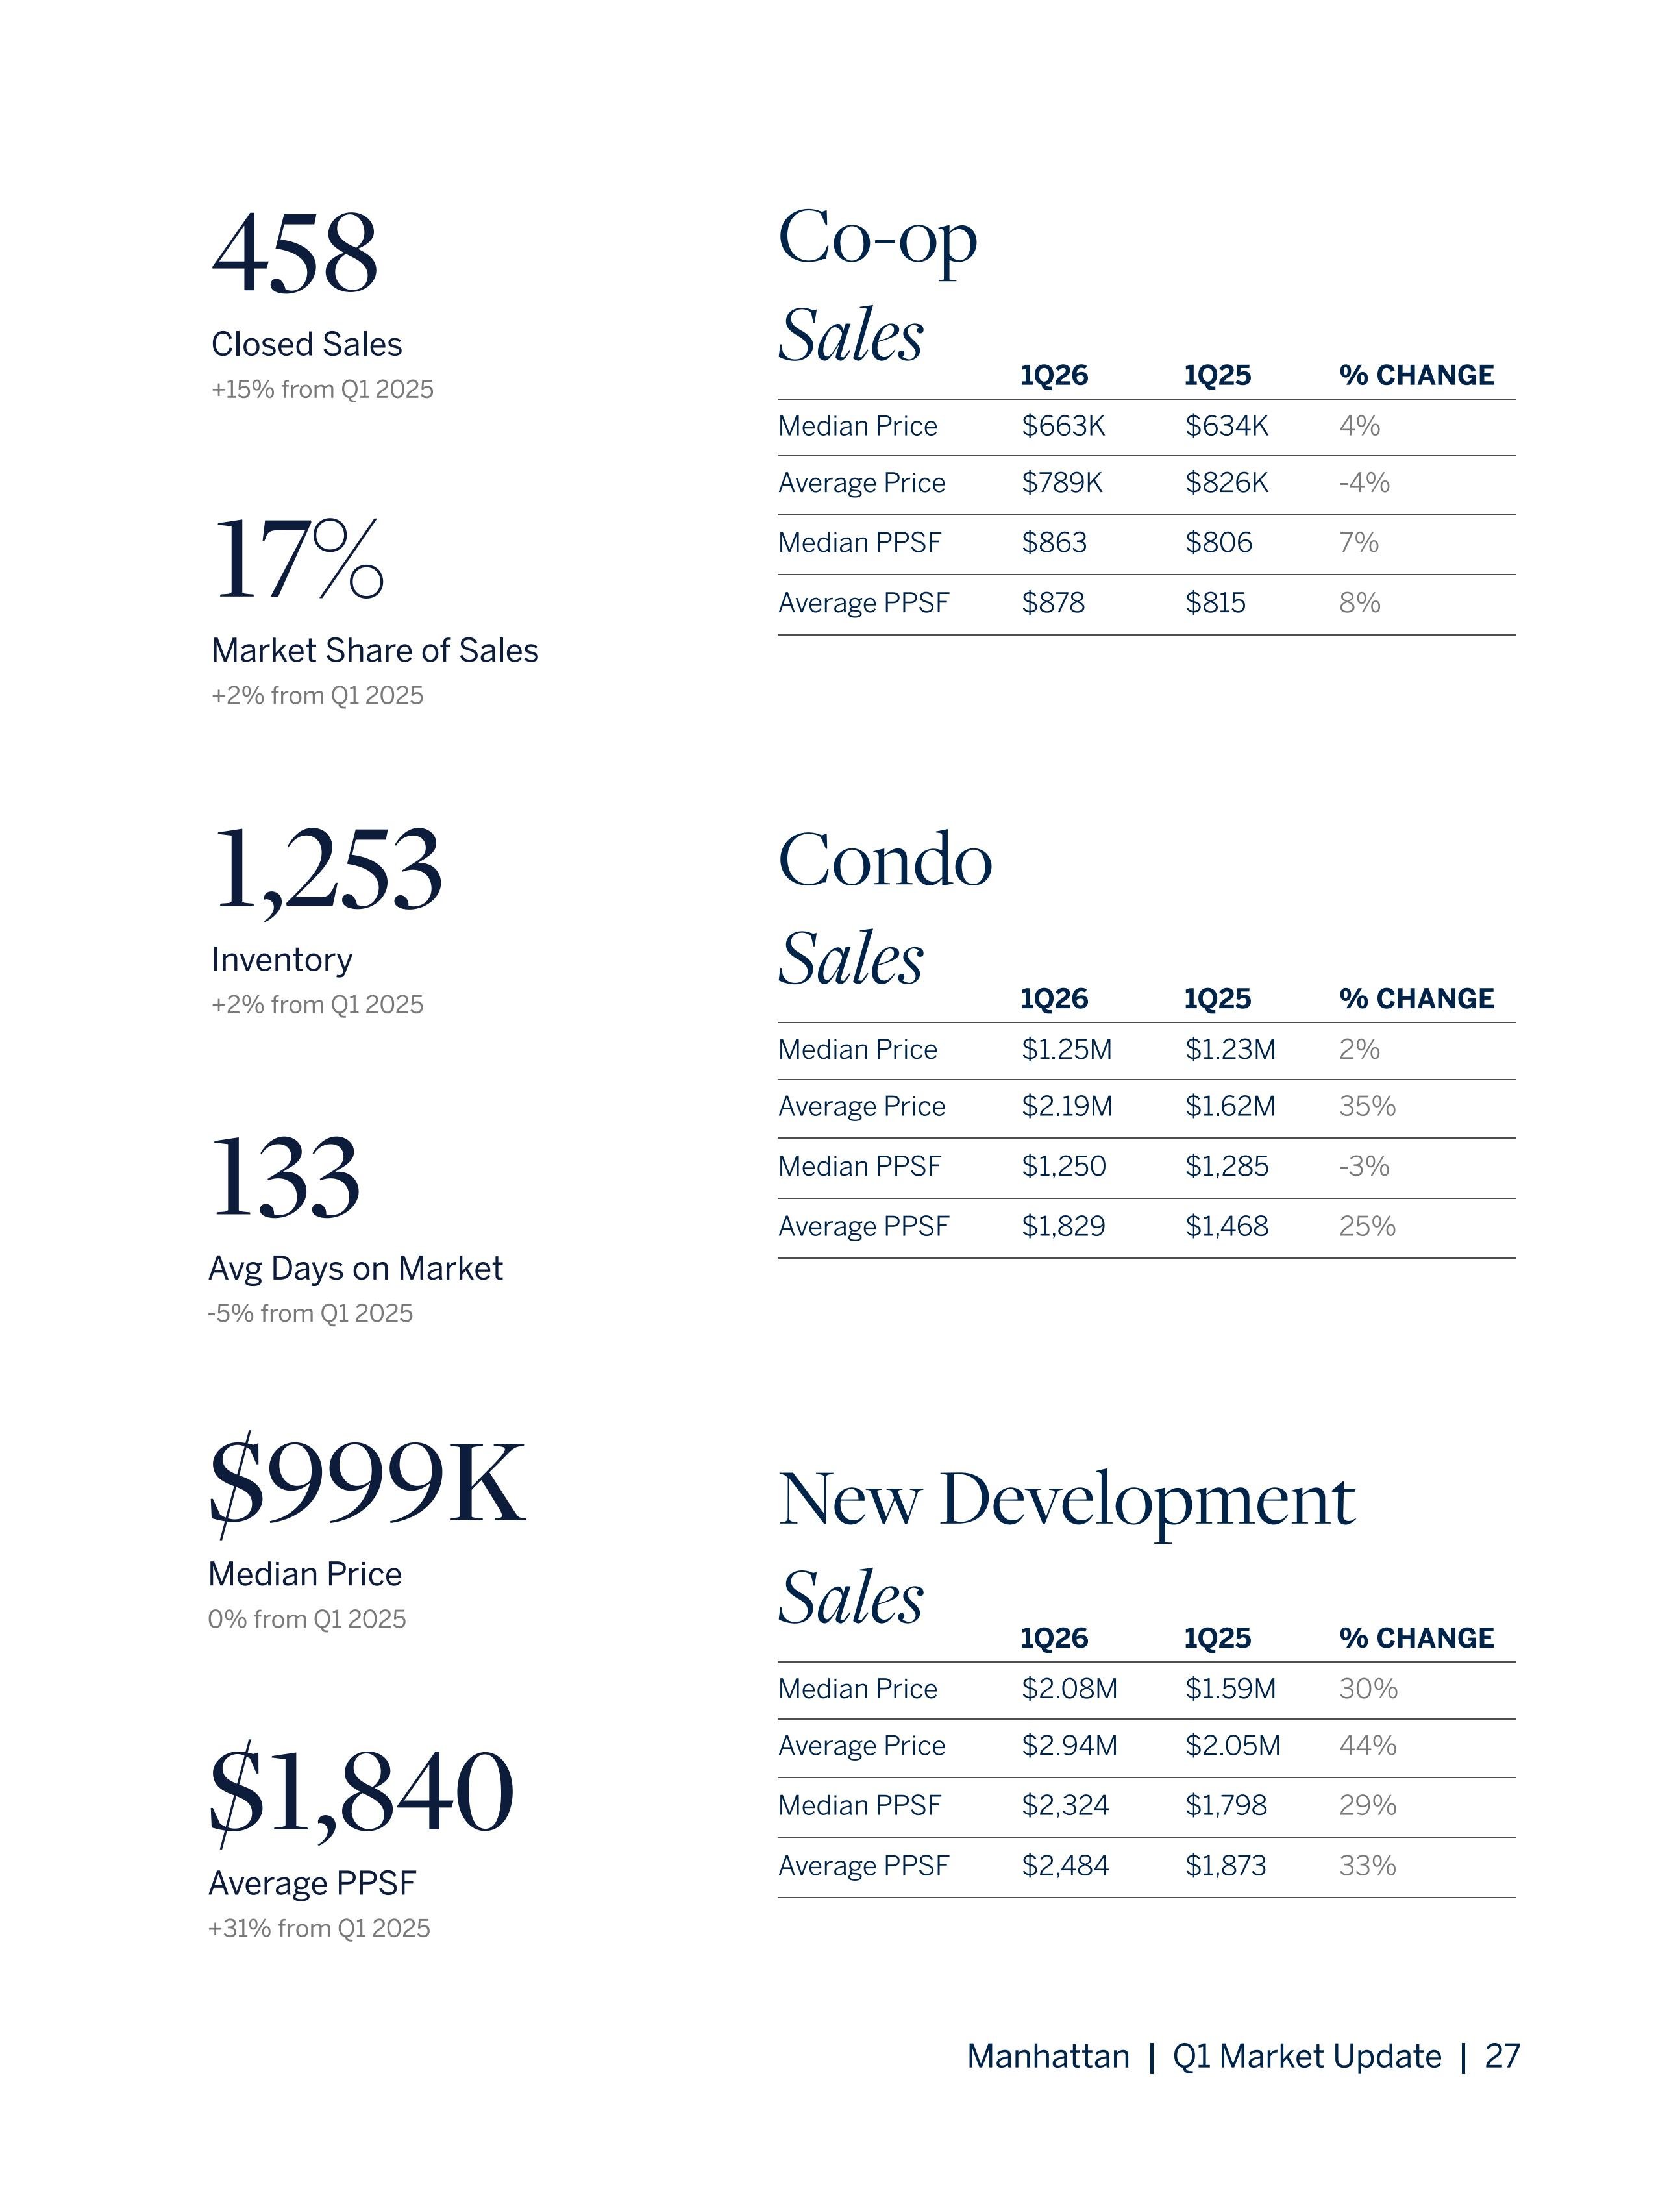
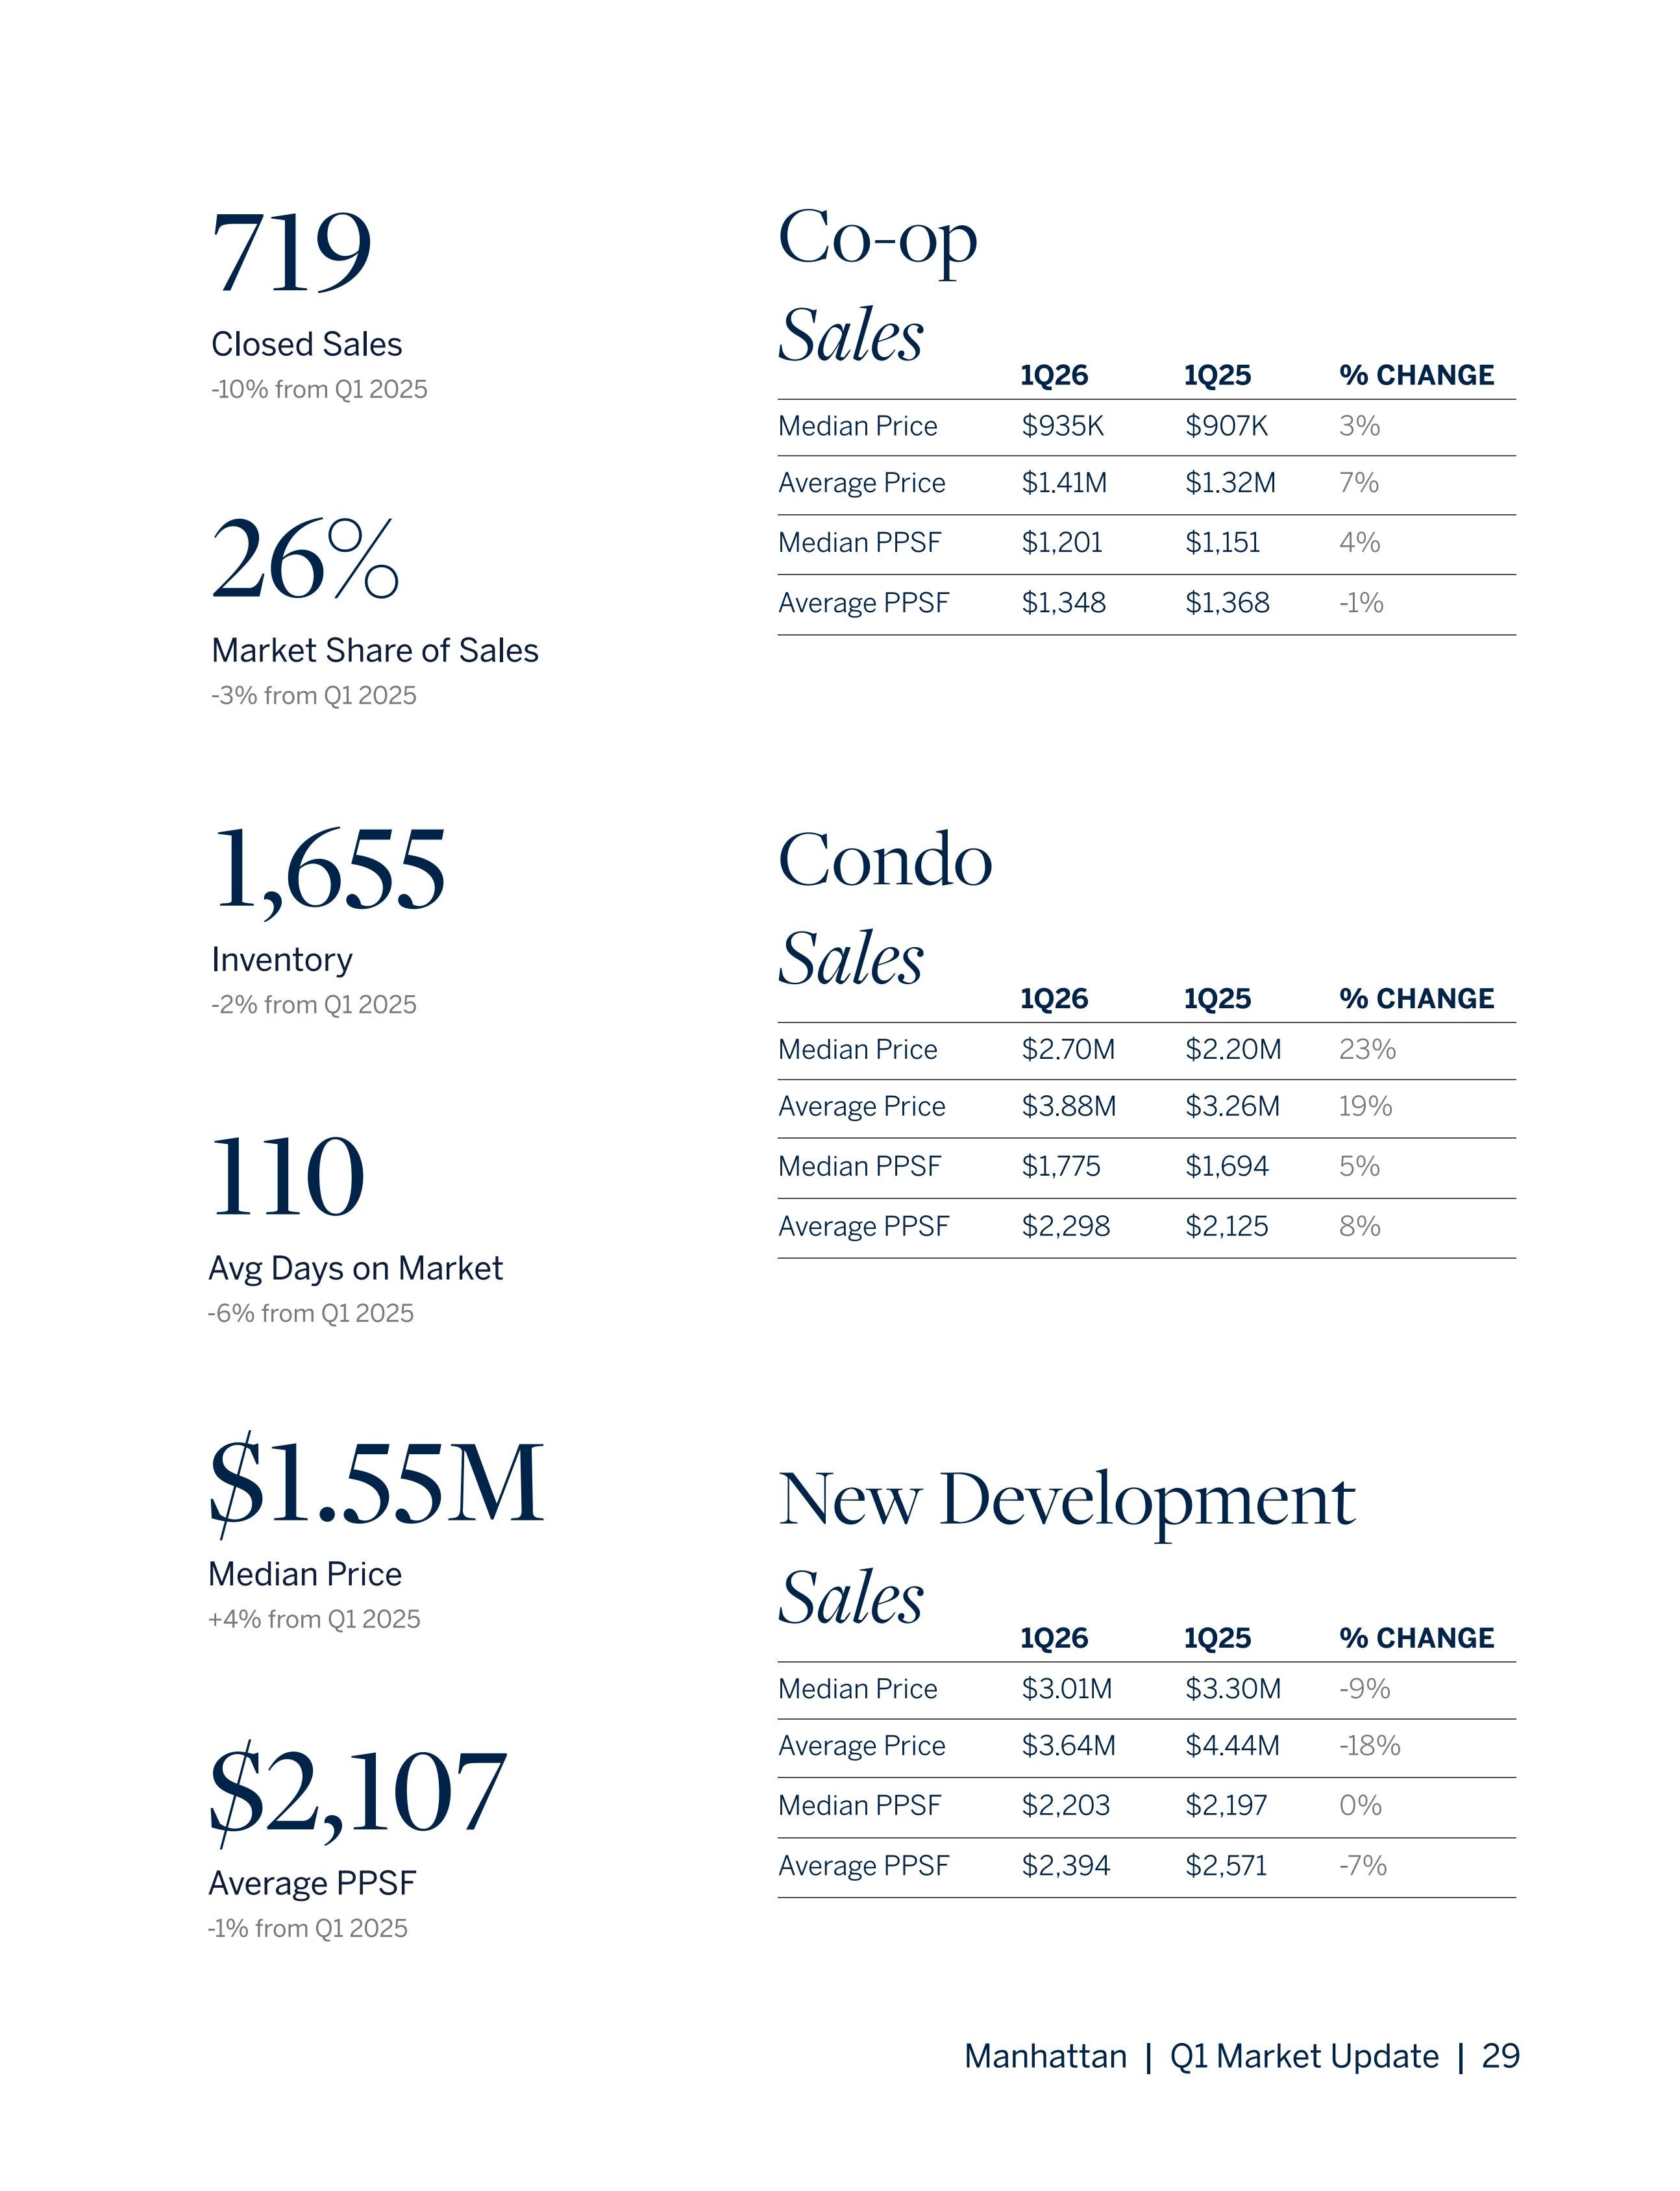
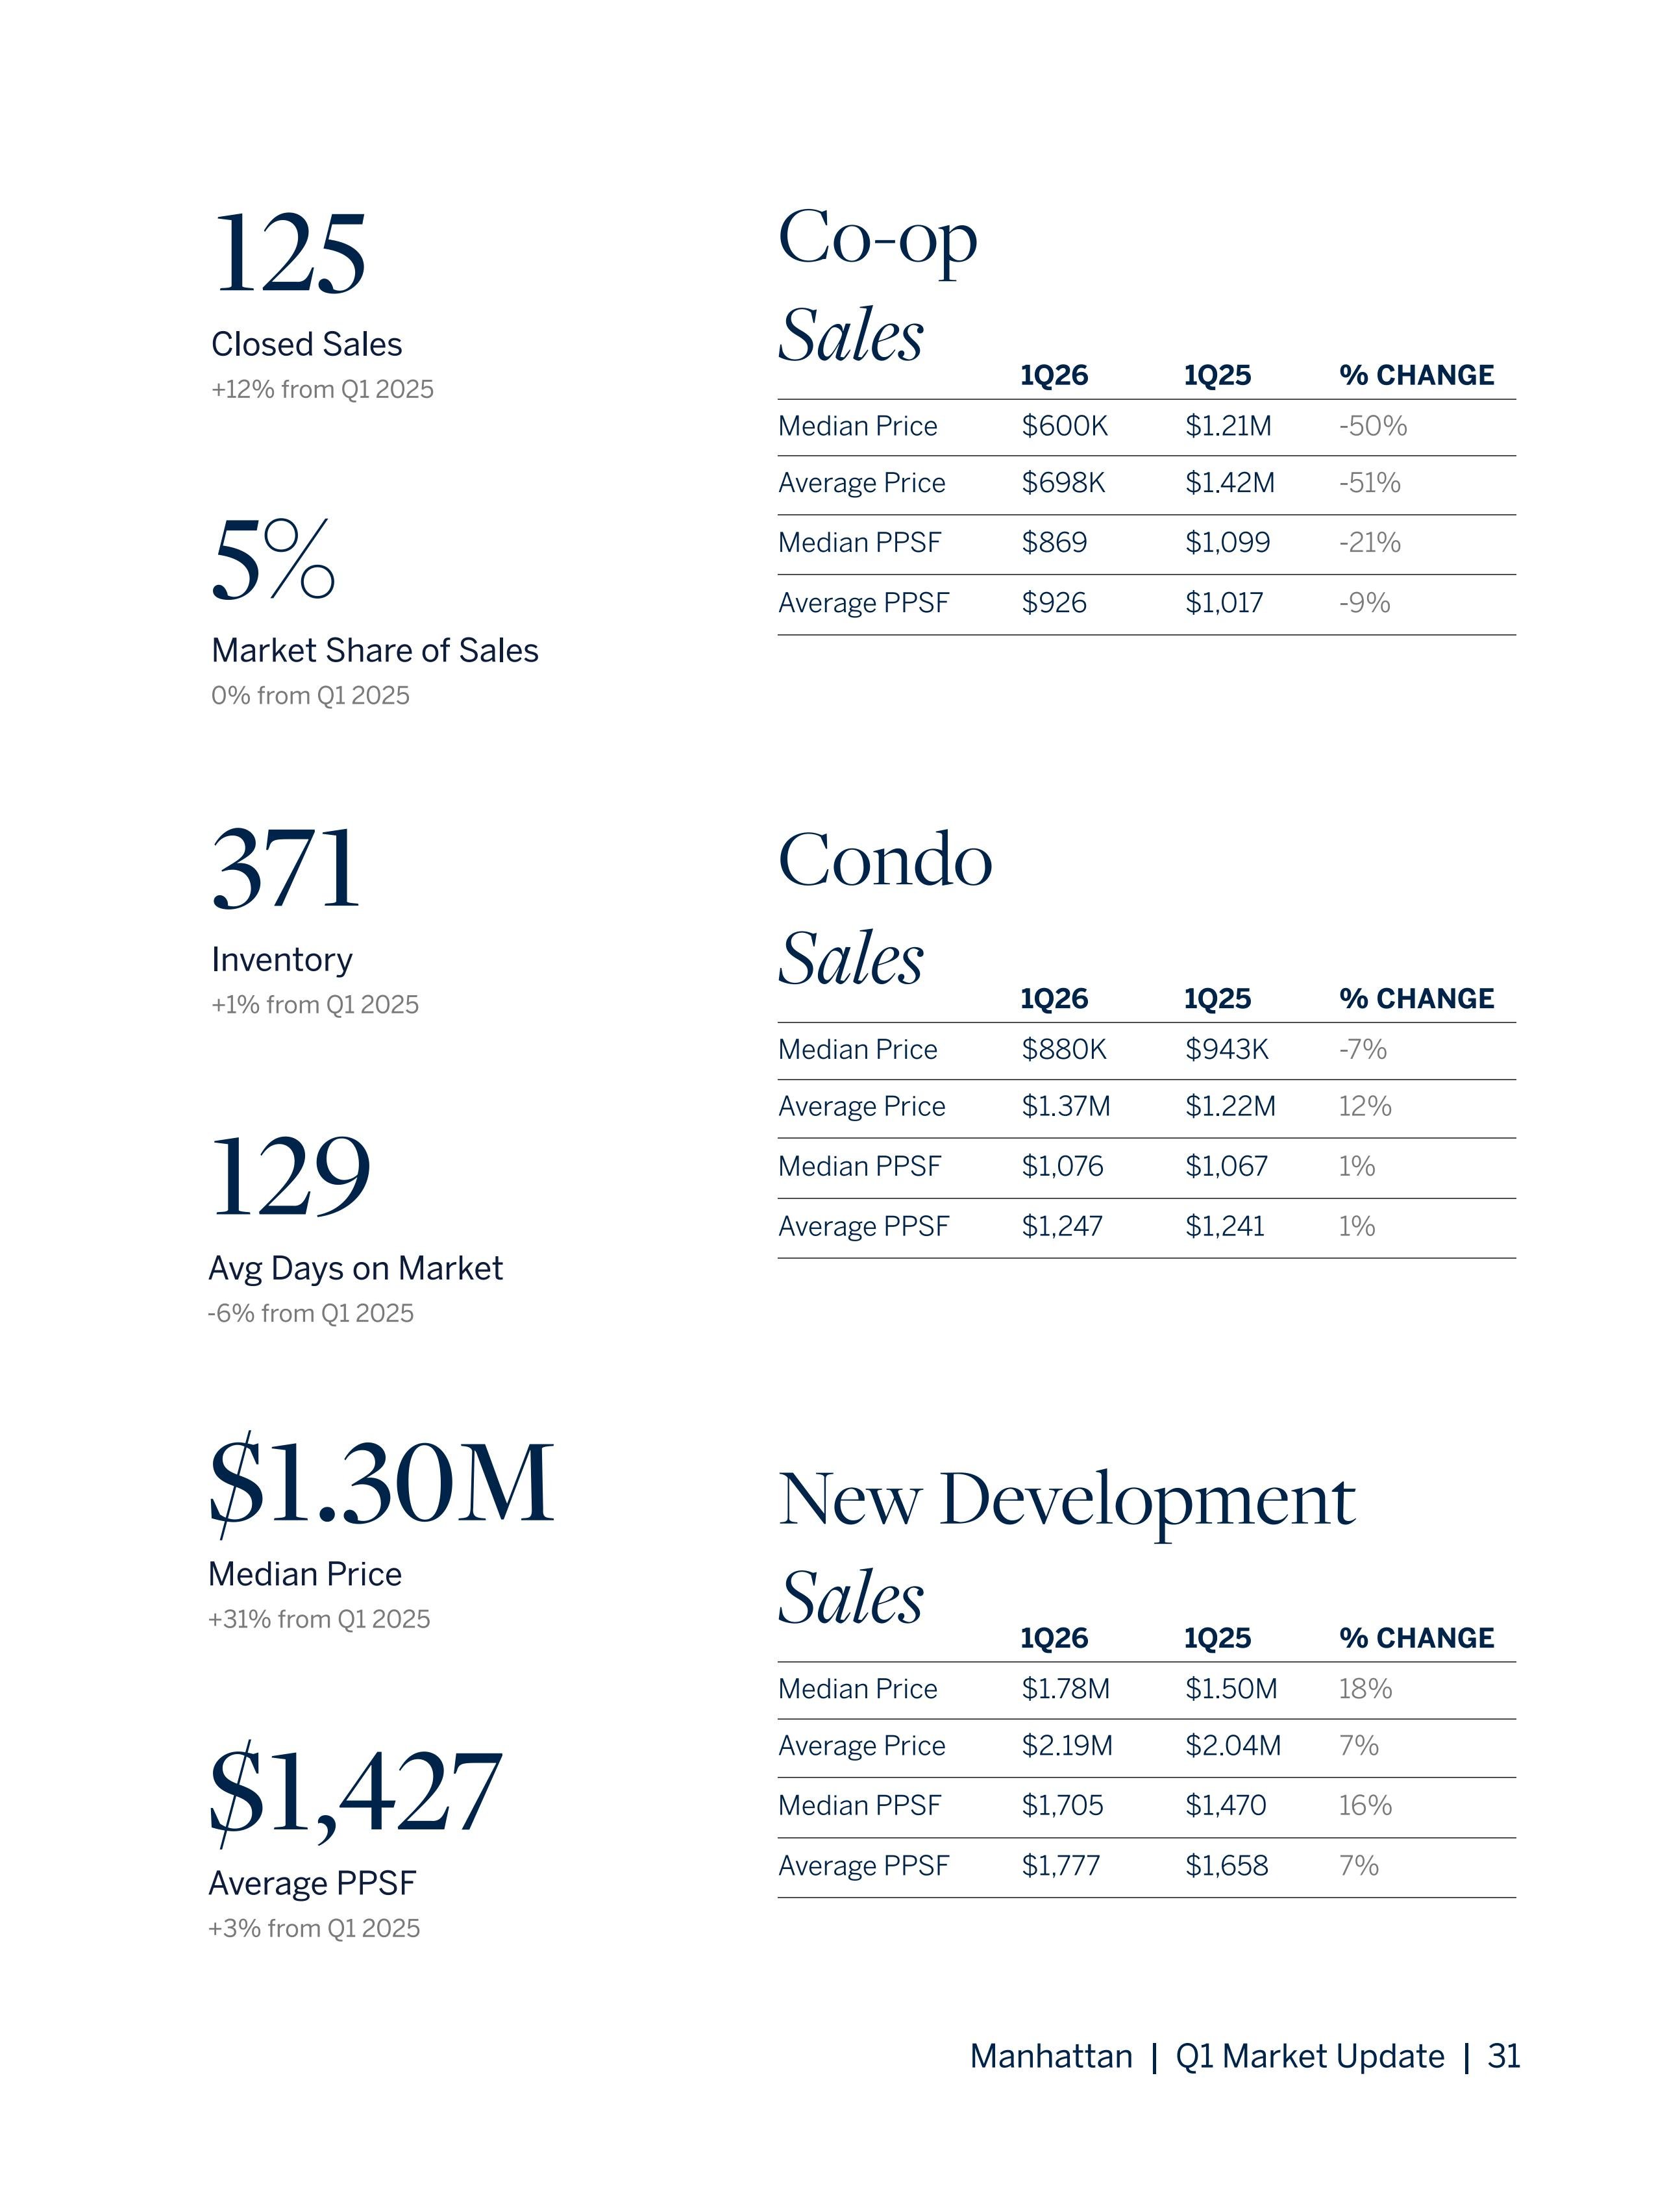
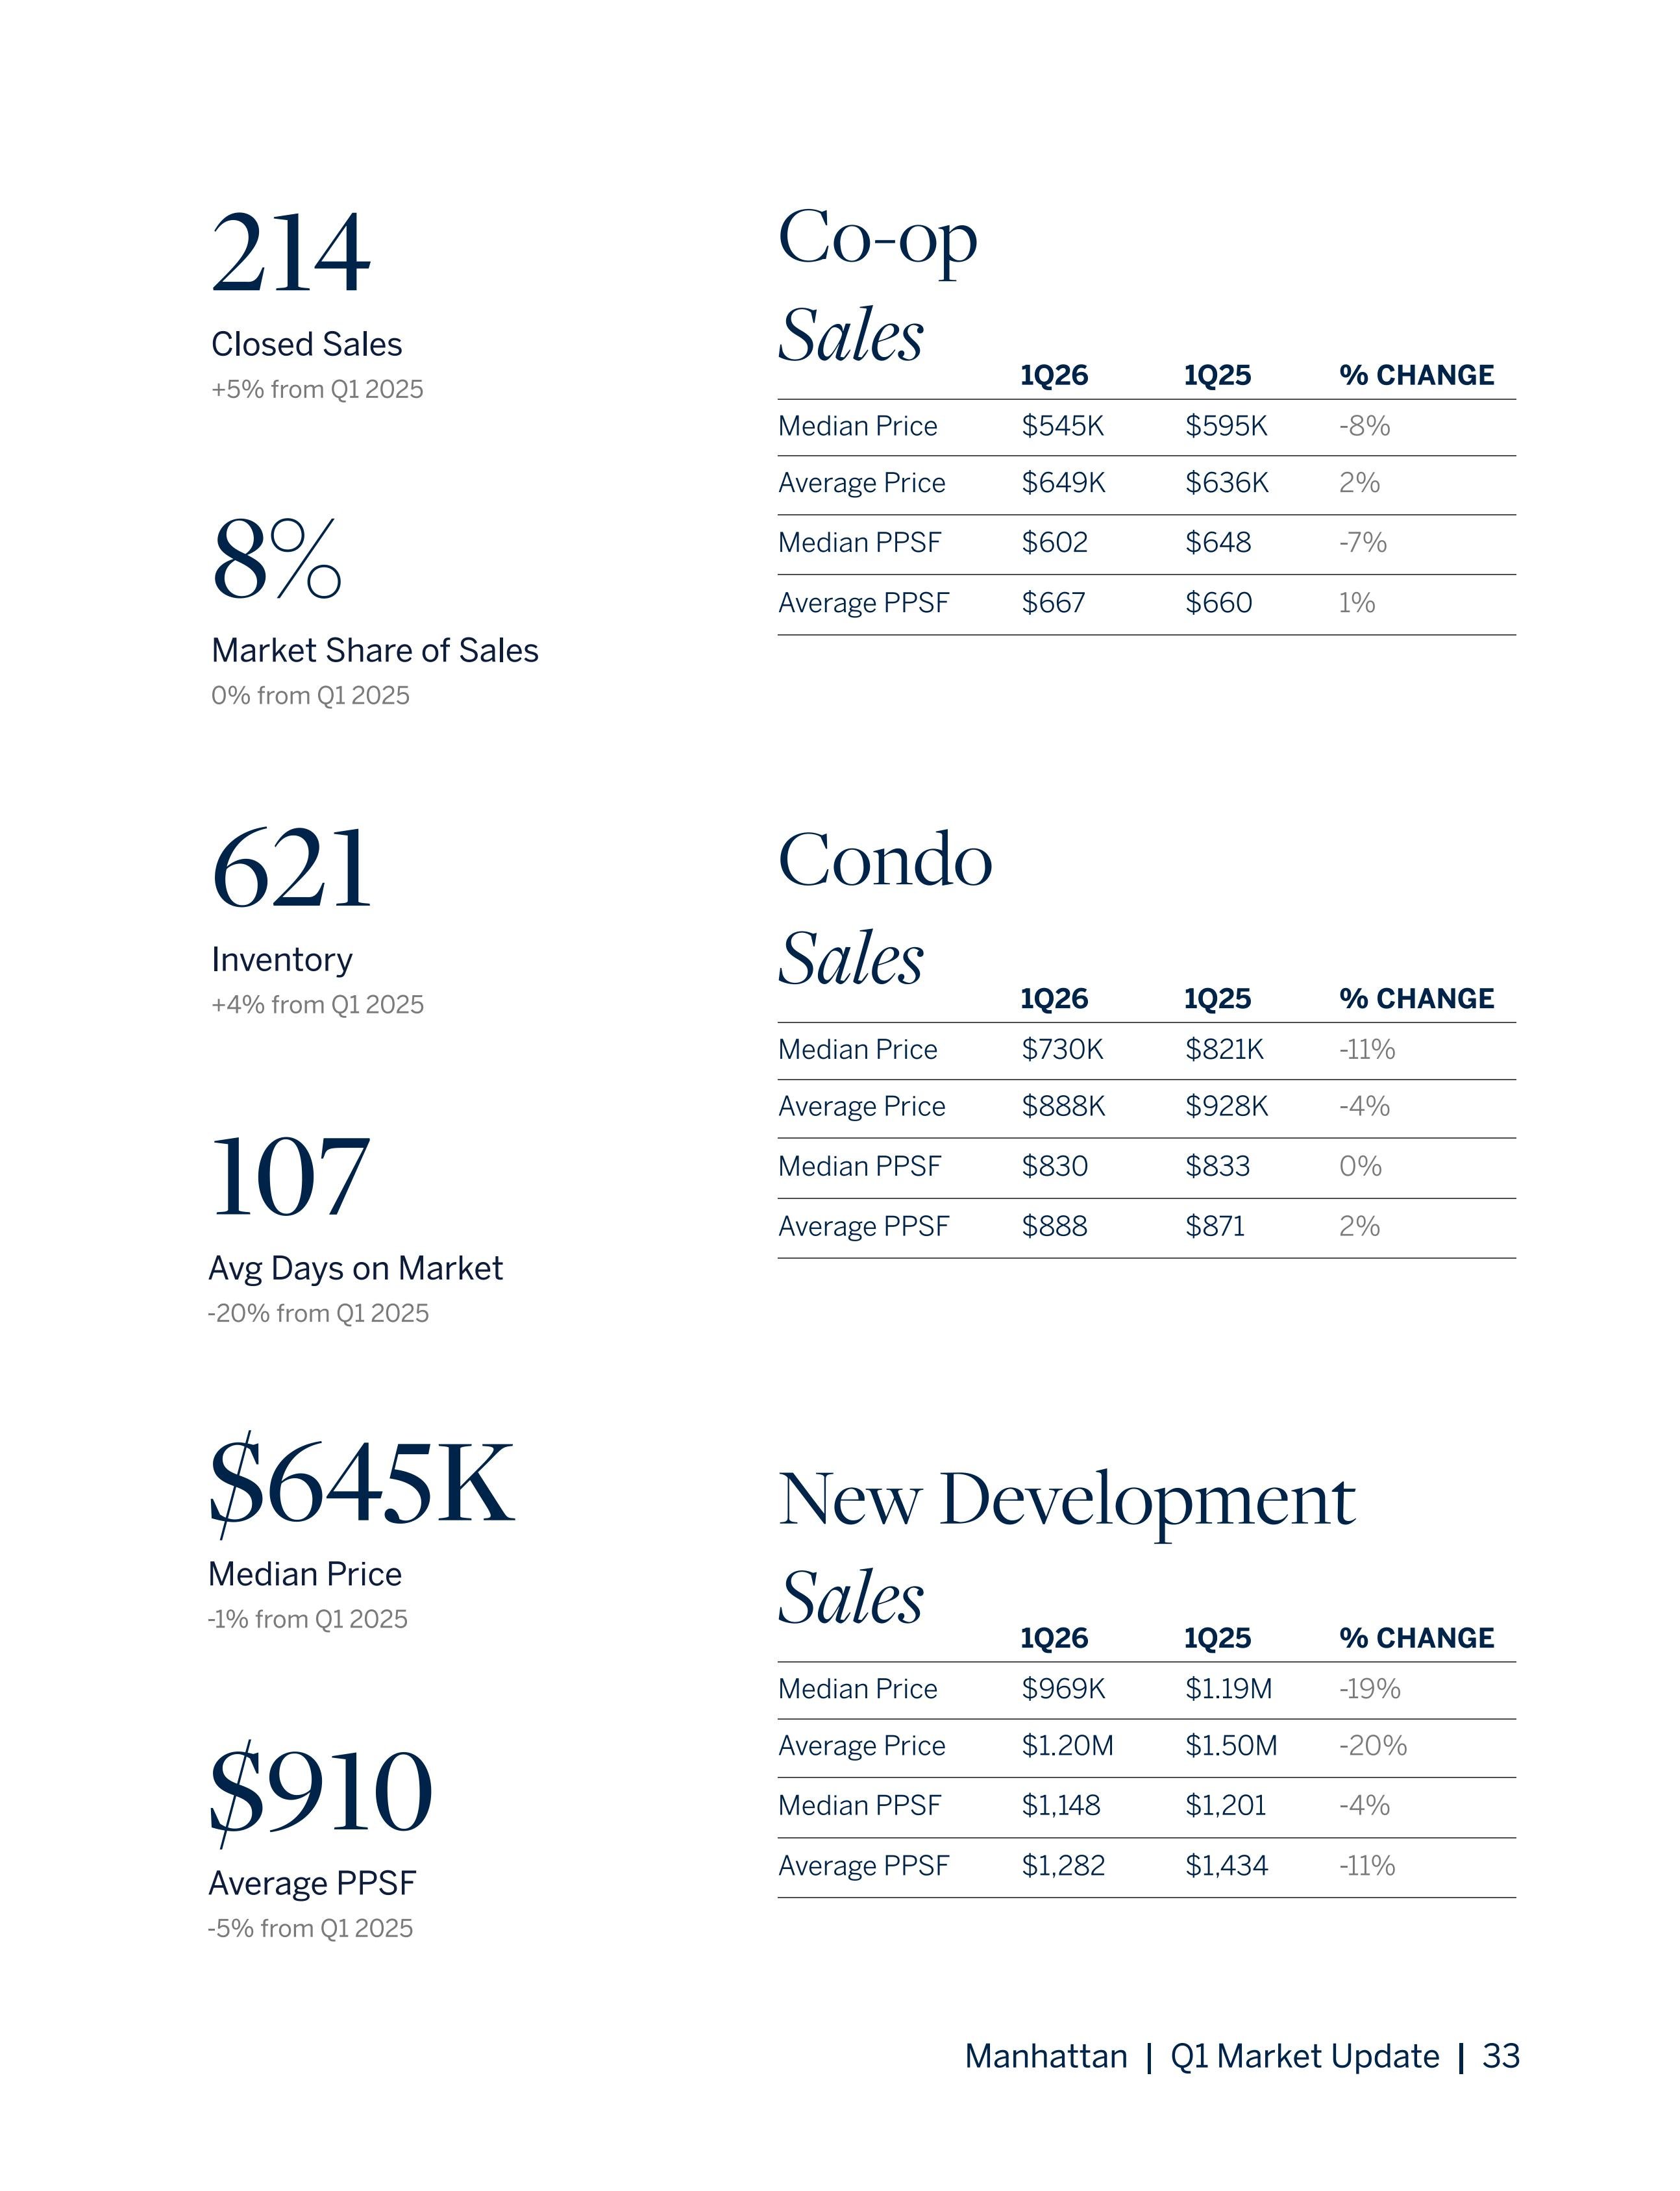
Manhattan Q1 market update infographic comparing co-op, condo, and new development sales with Q1 2025.
Upper West Side living room with a fireplace, built-in shelves, and leafy views through two windows.
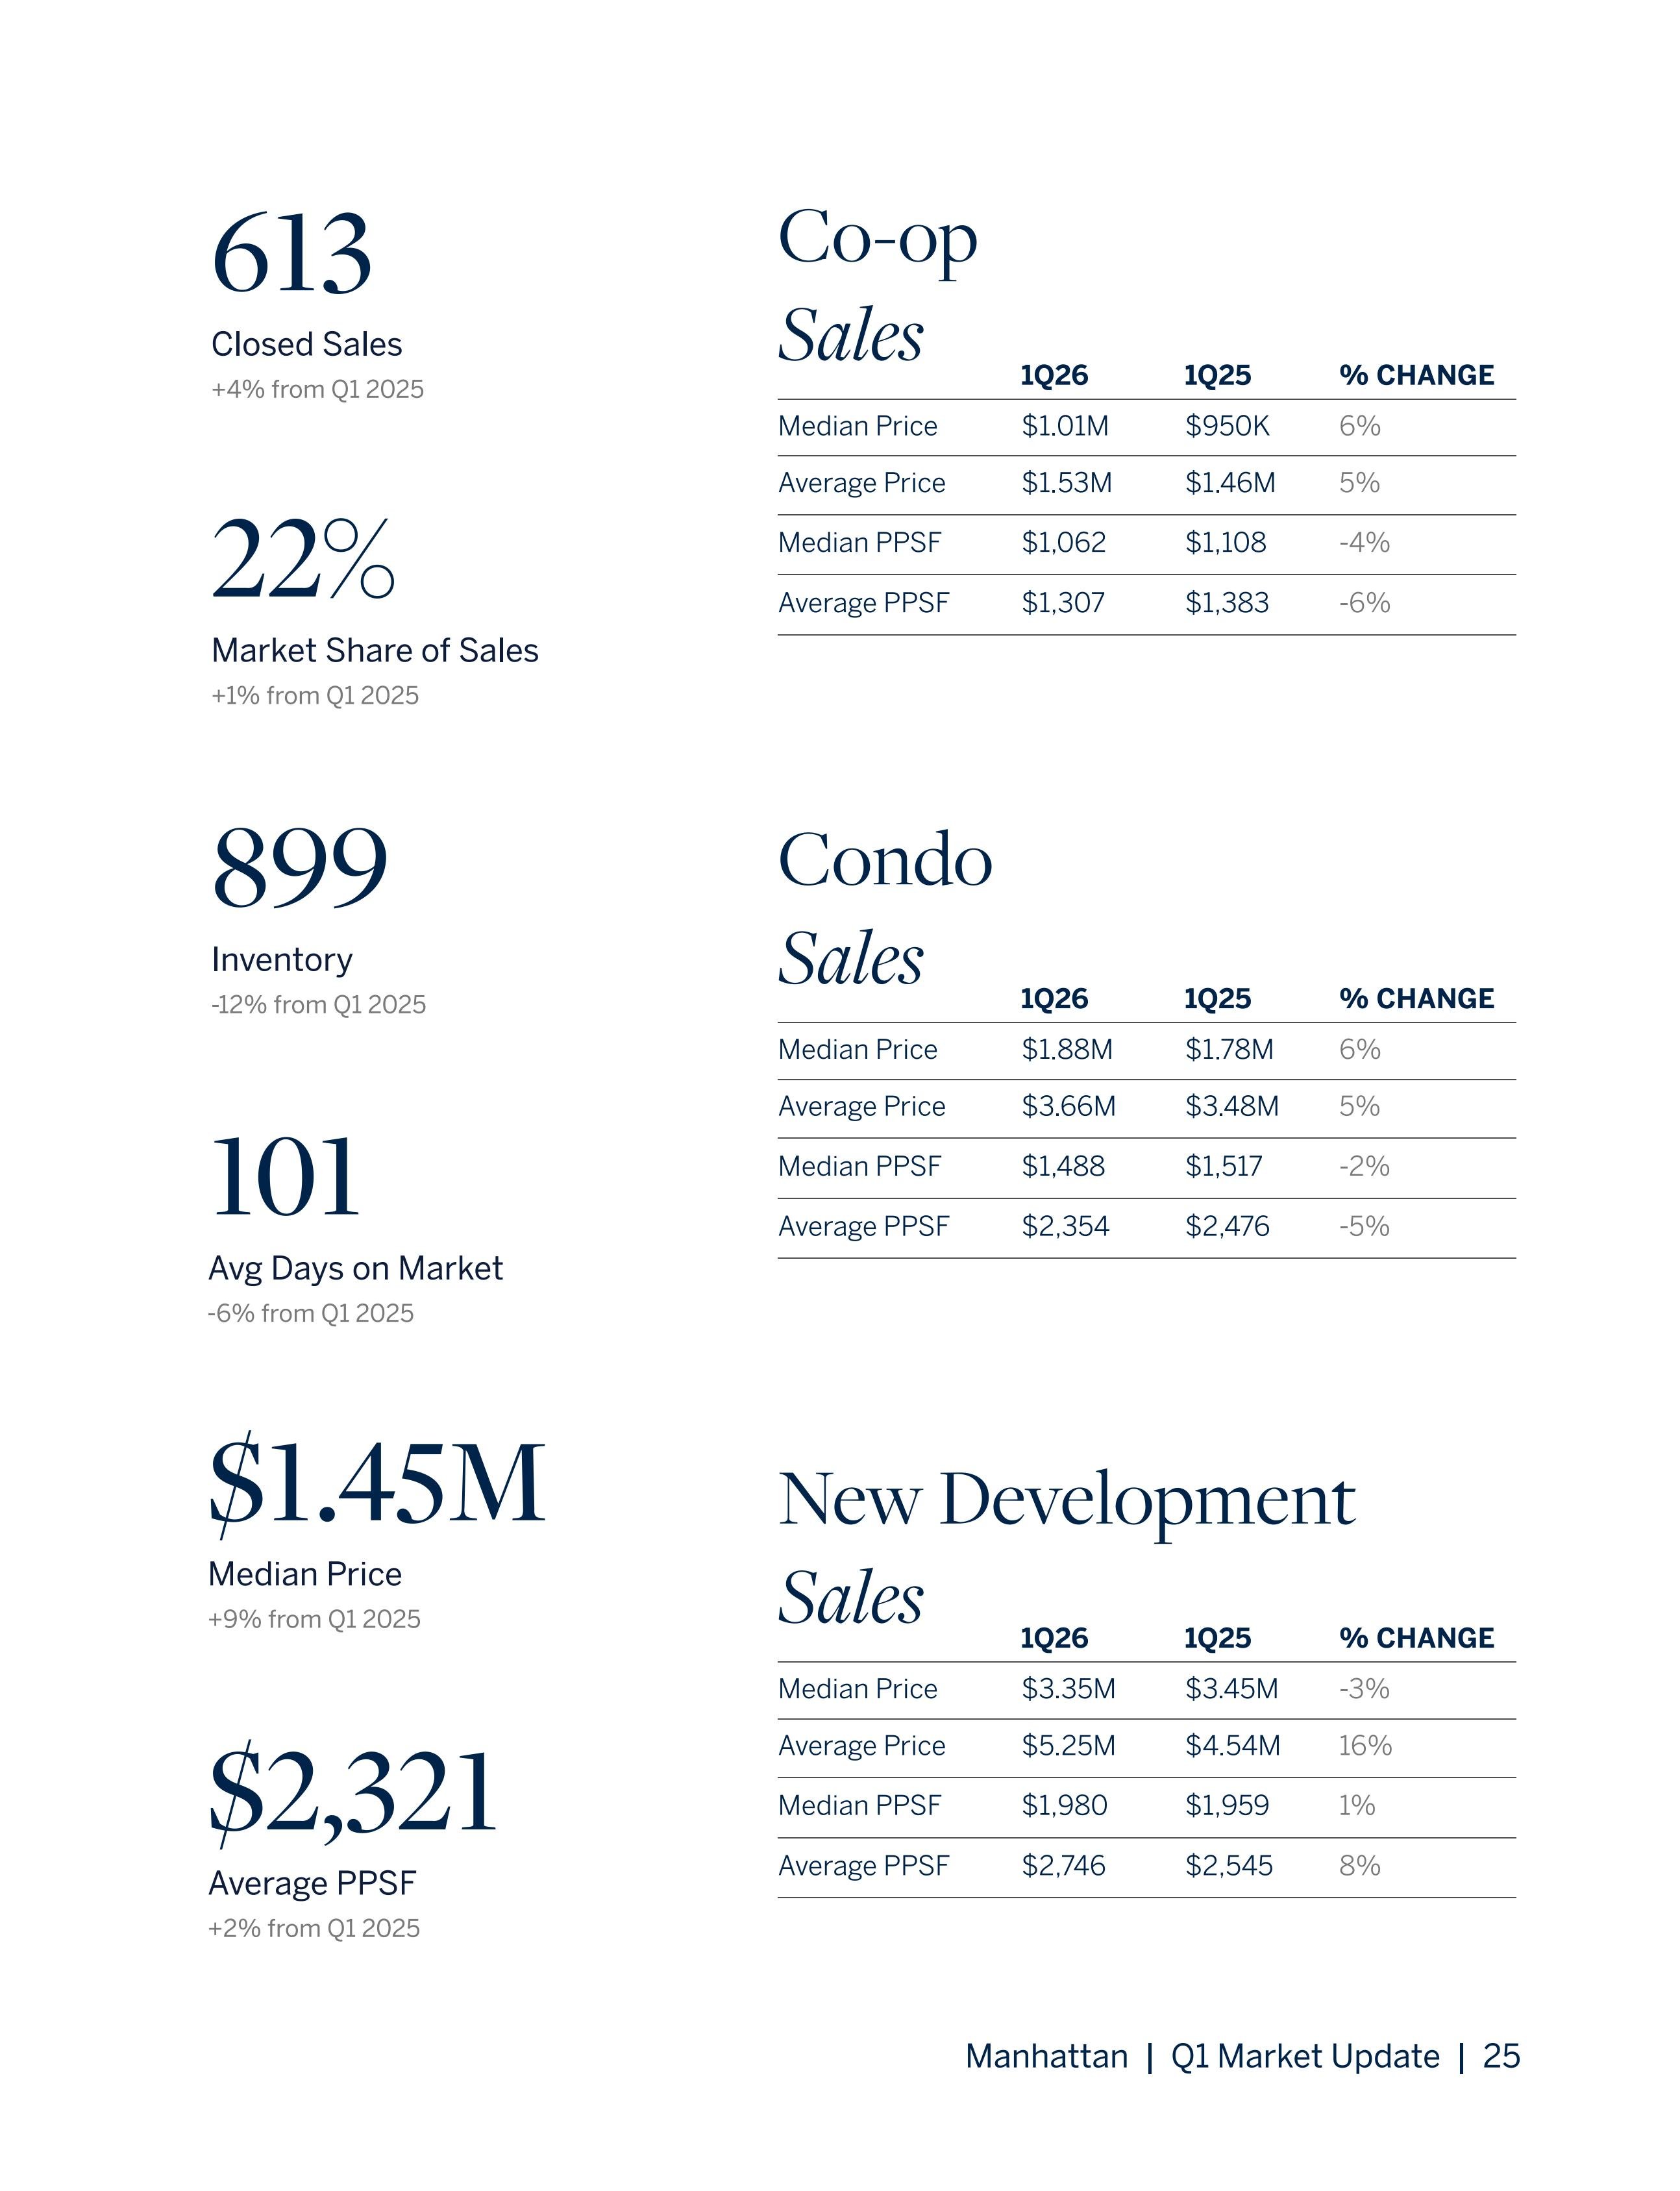
Manhattan Q1 market update infographic comparing co-op, condo, and new-development sales metrics.
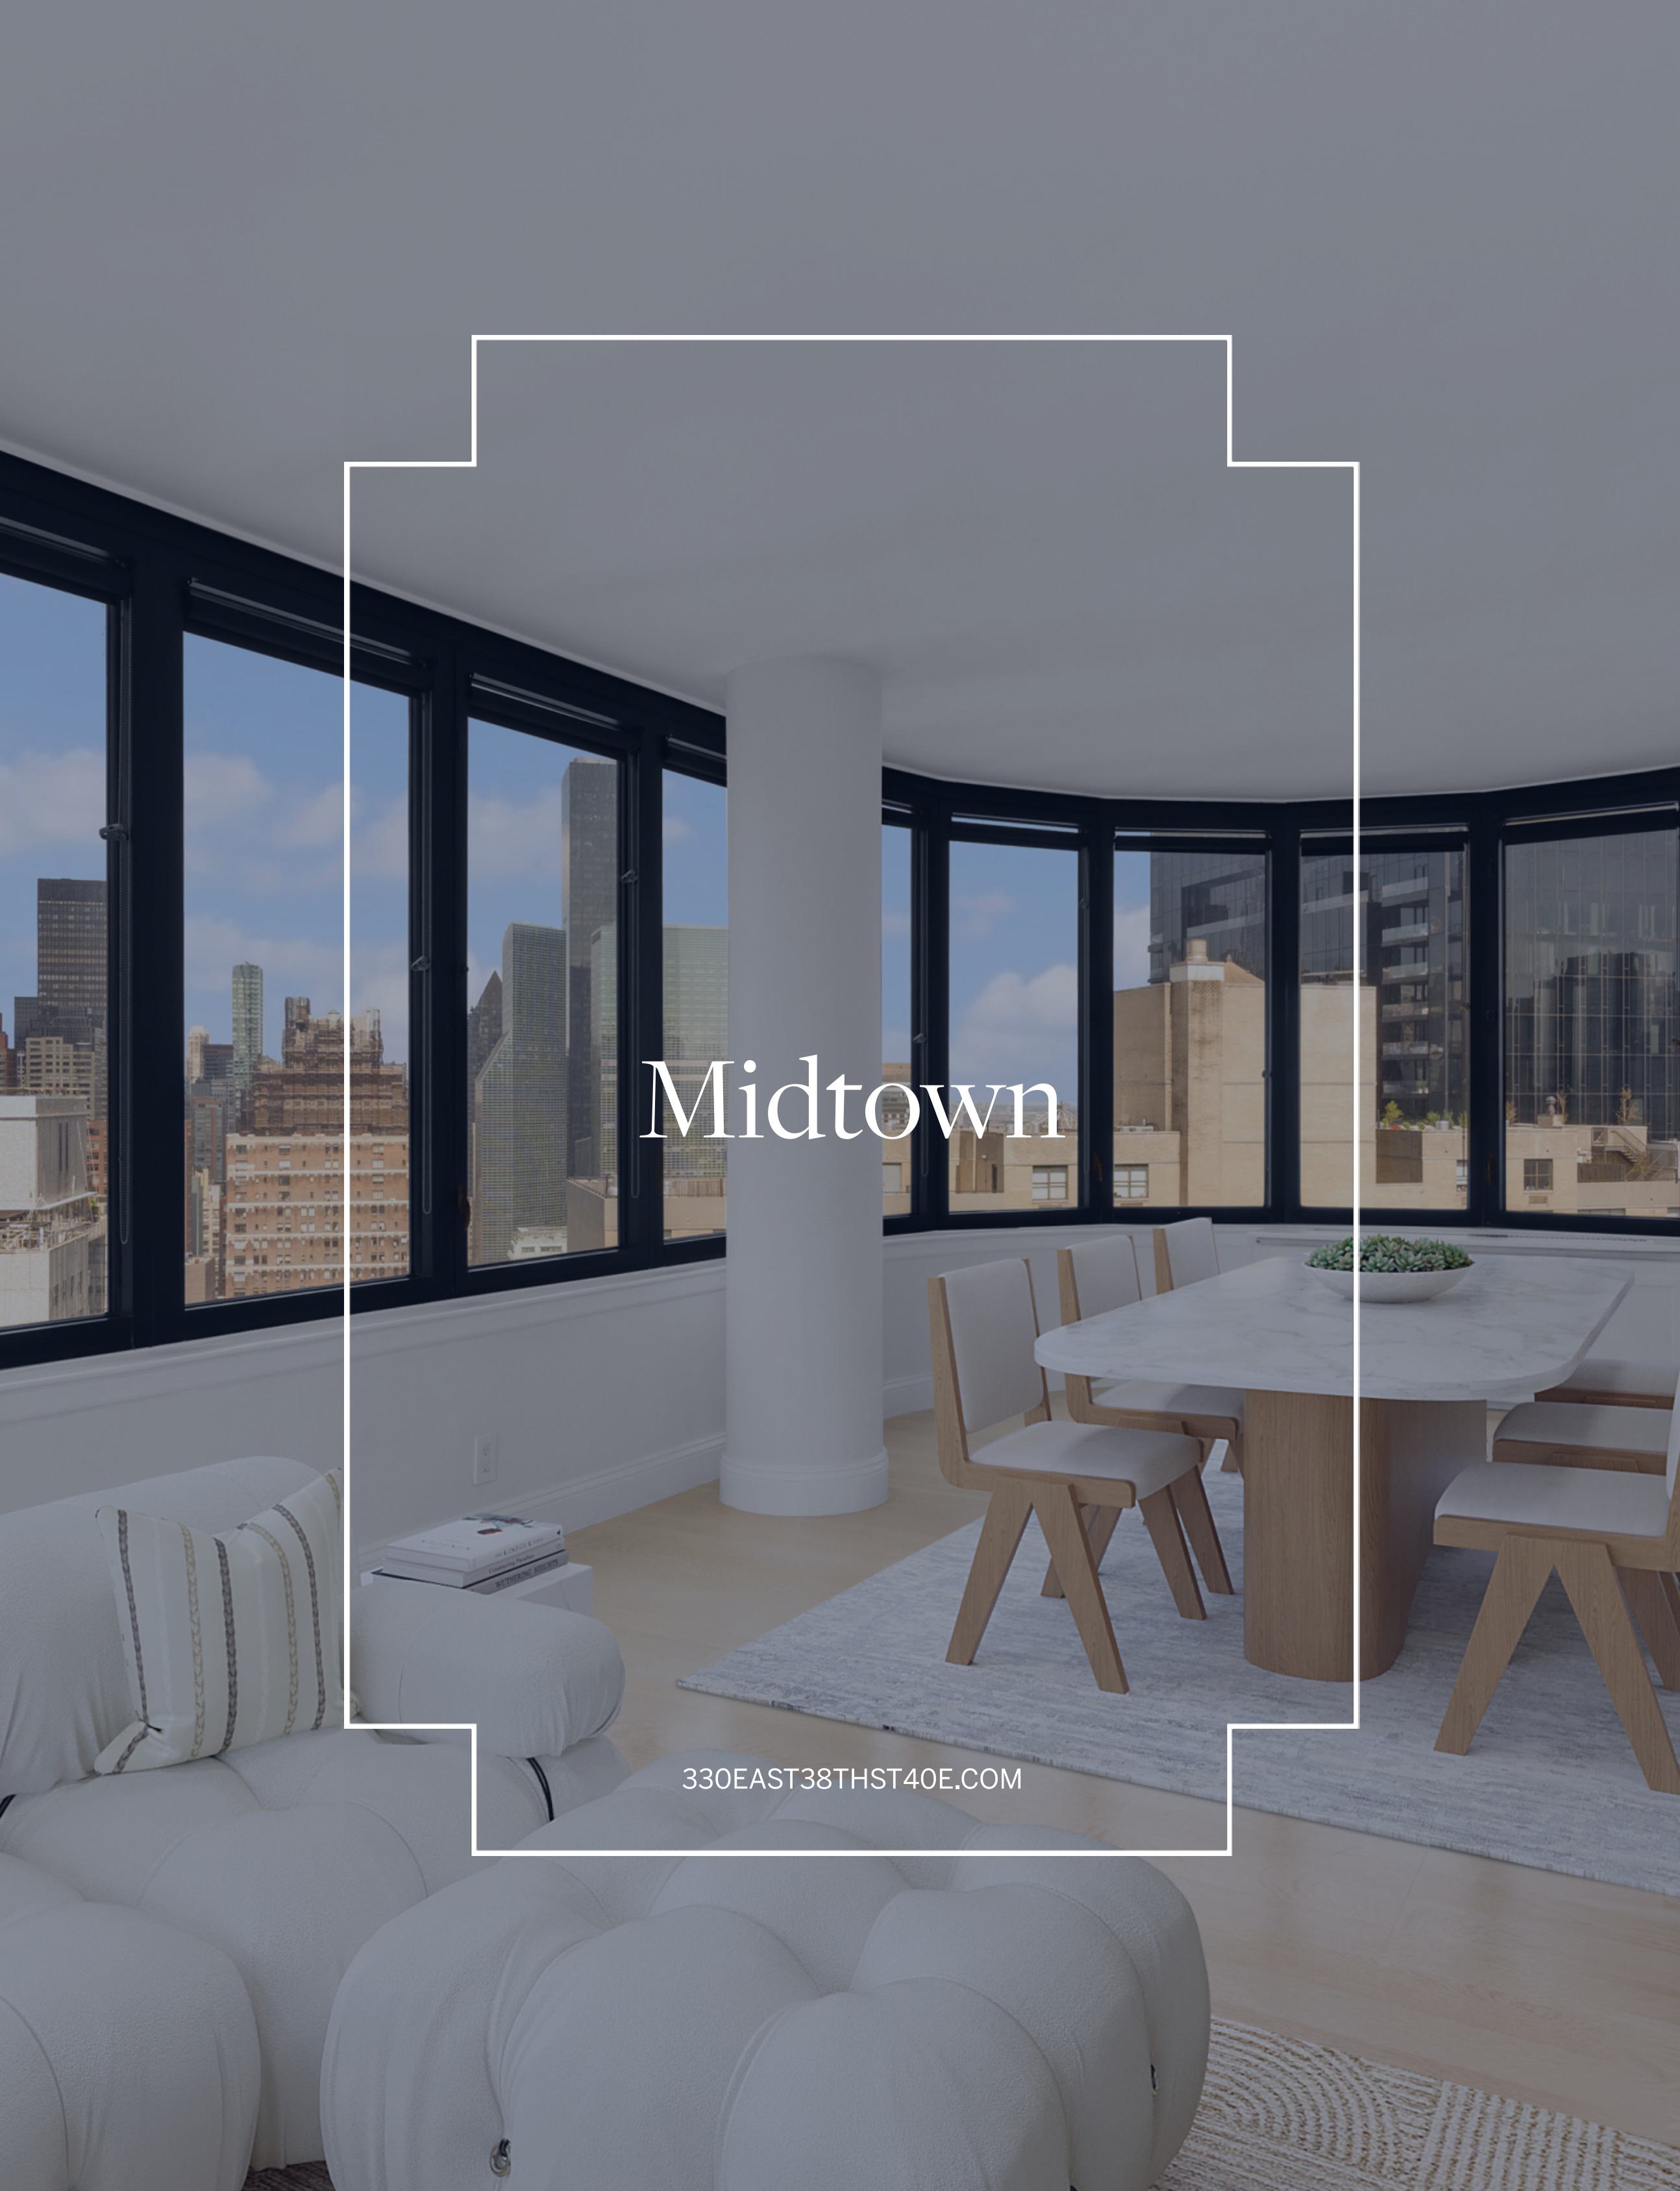
Furnished apartment dining area with floor-to-ceiling windows overlooking Midtown buildings.
Manhattan Q1 market infographic with sales, inventory, pricing, and co-op, condo, and new development comparisons.
Open-plan living room with leather sofas, patterned rugs, and sculptural pendant lighting.
Manhattan Q1 market update infographic with key statistics and co-op, condo, and new development sales tables.
Furnished outdoor terrace with wood lounge seating, flowering planters, and neighboring Manhattan buildings.
Manhattan Q1 2026 market update with sales, inventory, prices, and co-op, condo, and new-development comparisons.
Furnished dining room with dark wood paneling, a branching chandelier, and open doors to a living room.
Manhattan Q1 market update infographic comparing co-op, condo, and new development sales with key metrics.
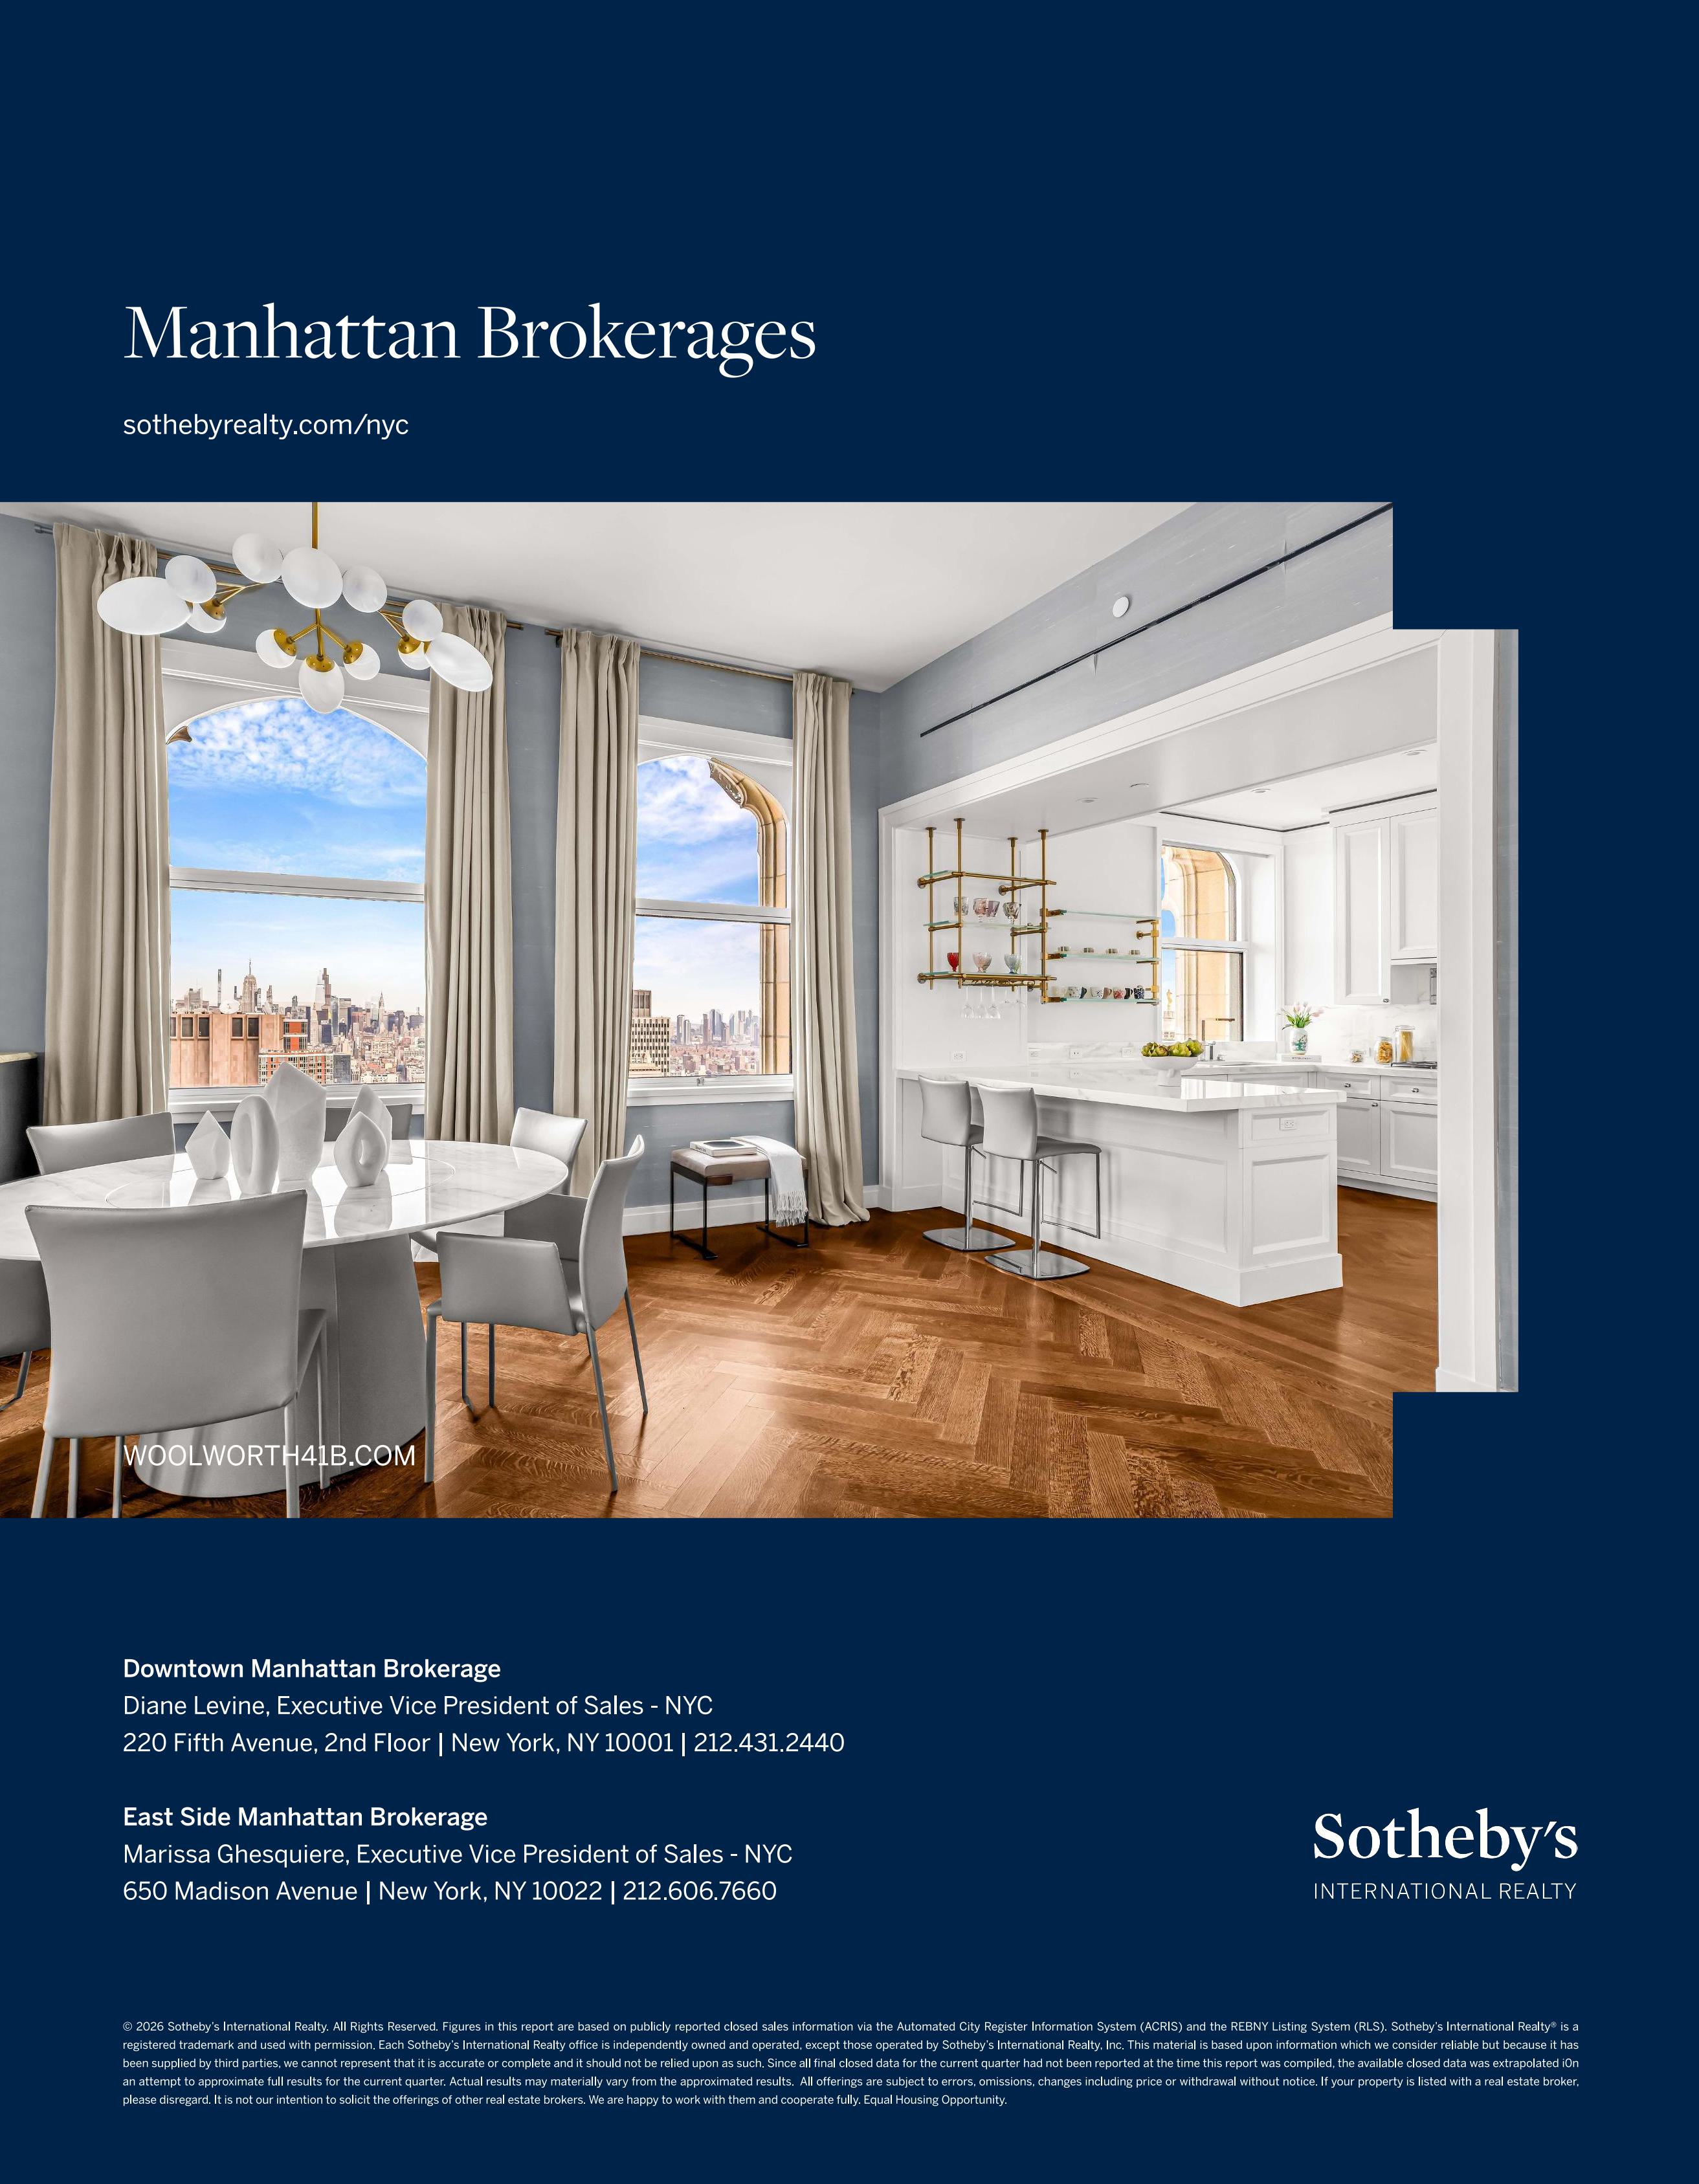
Manhattan brokerage contacts and Sotheby’s International Realty branding, over a dining room and kitchen with skyline views.
Manhattan Q1 market update with neighborhood sales, median prices, average price per square foot, and inventory statistics.

Work With Michael

Finding an agent who is not only knowledgeable in both markets, but also trusted and respected can be tricky, but with Michael Meier representing you that is what you will have every time.