Manhattan Quarterly Report: Q4 2021

Manhattan Quarterly Report: Q4 2021

  • Michael Meier
  • January 13, 2022

Manhattan Q4 2021 real estate market report with sales and pricing statistics.

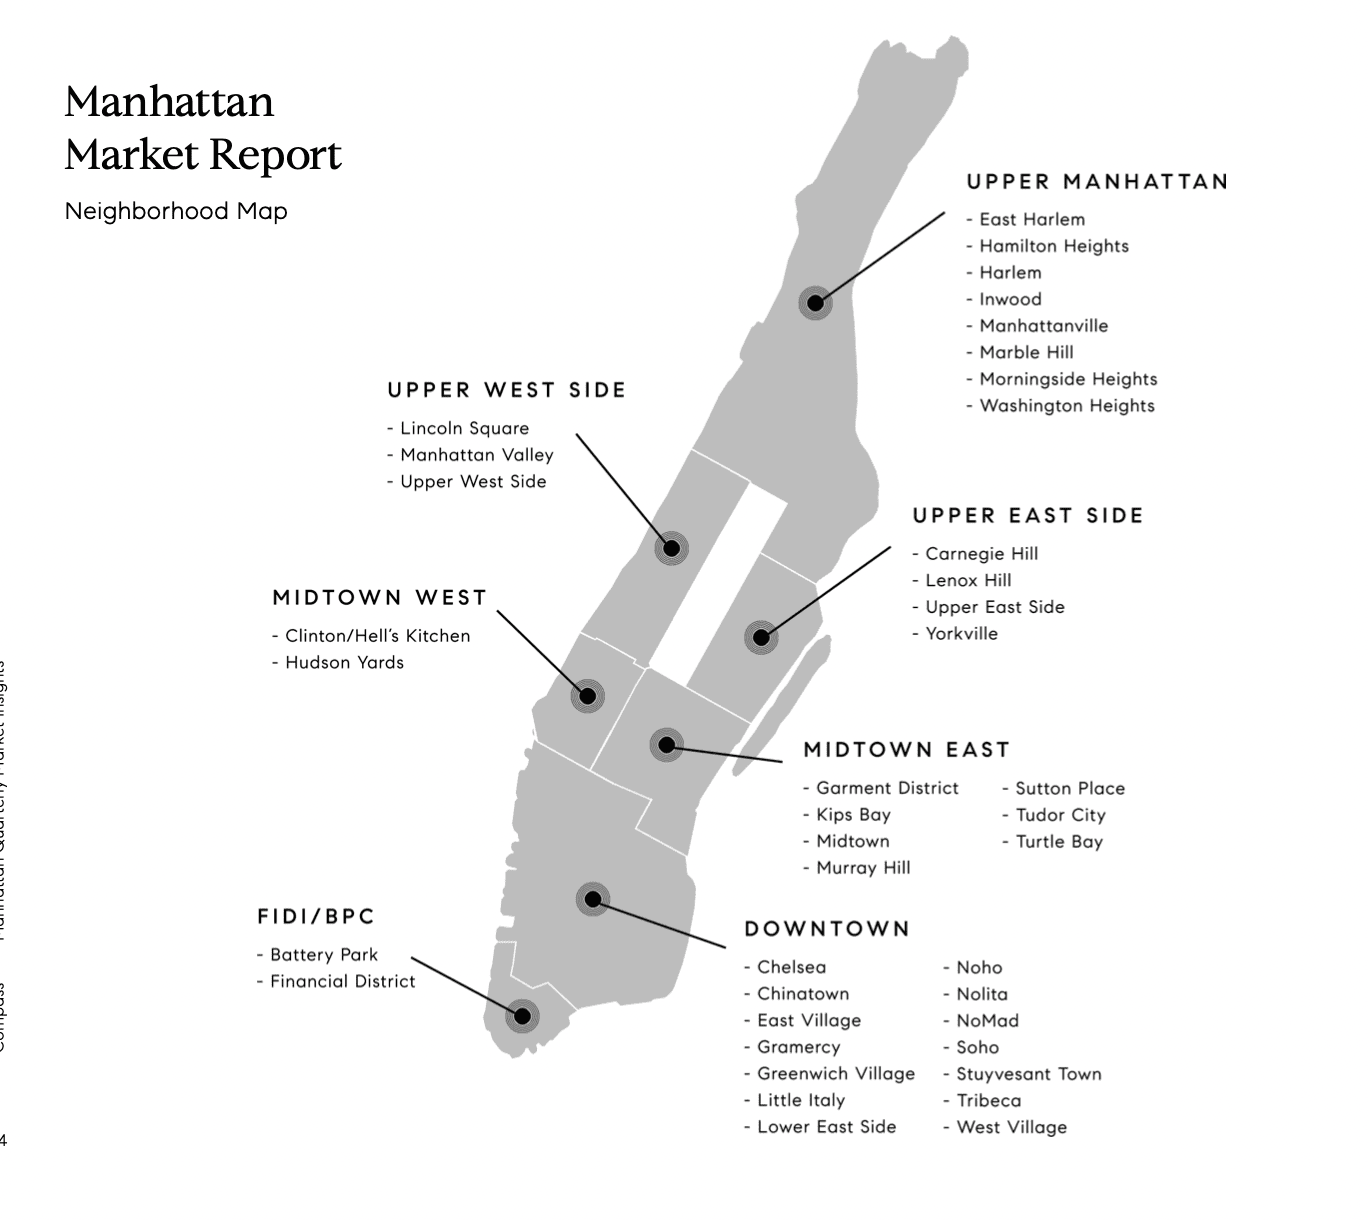
Manhattan Market Report neighborhood map with labeled regions and neighborhoods.

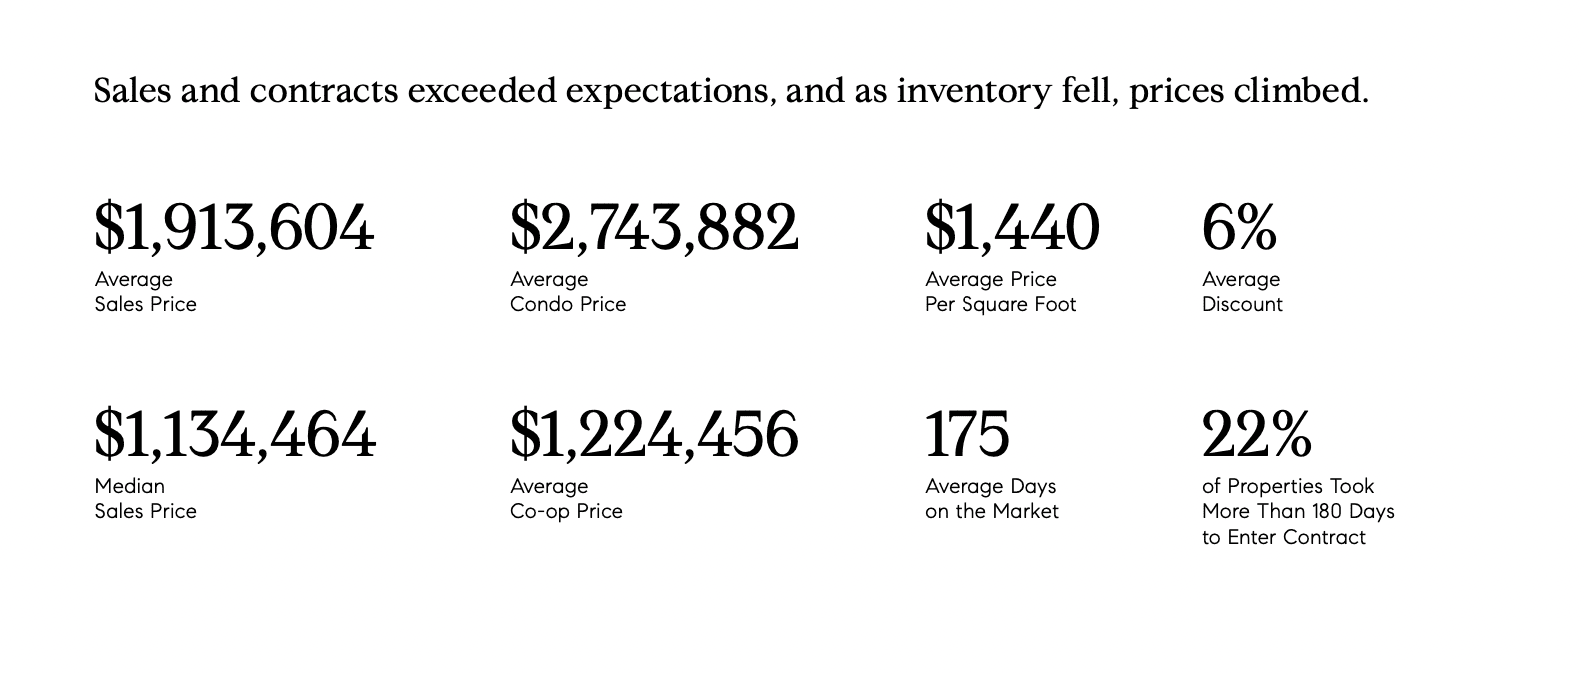
Manhattan Q4 2021 market report: average sale price $1,913,604, with 175 average days on market.

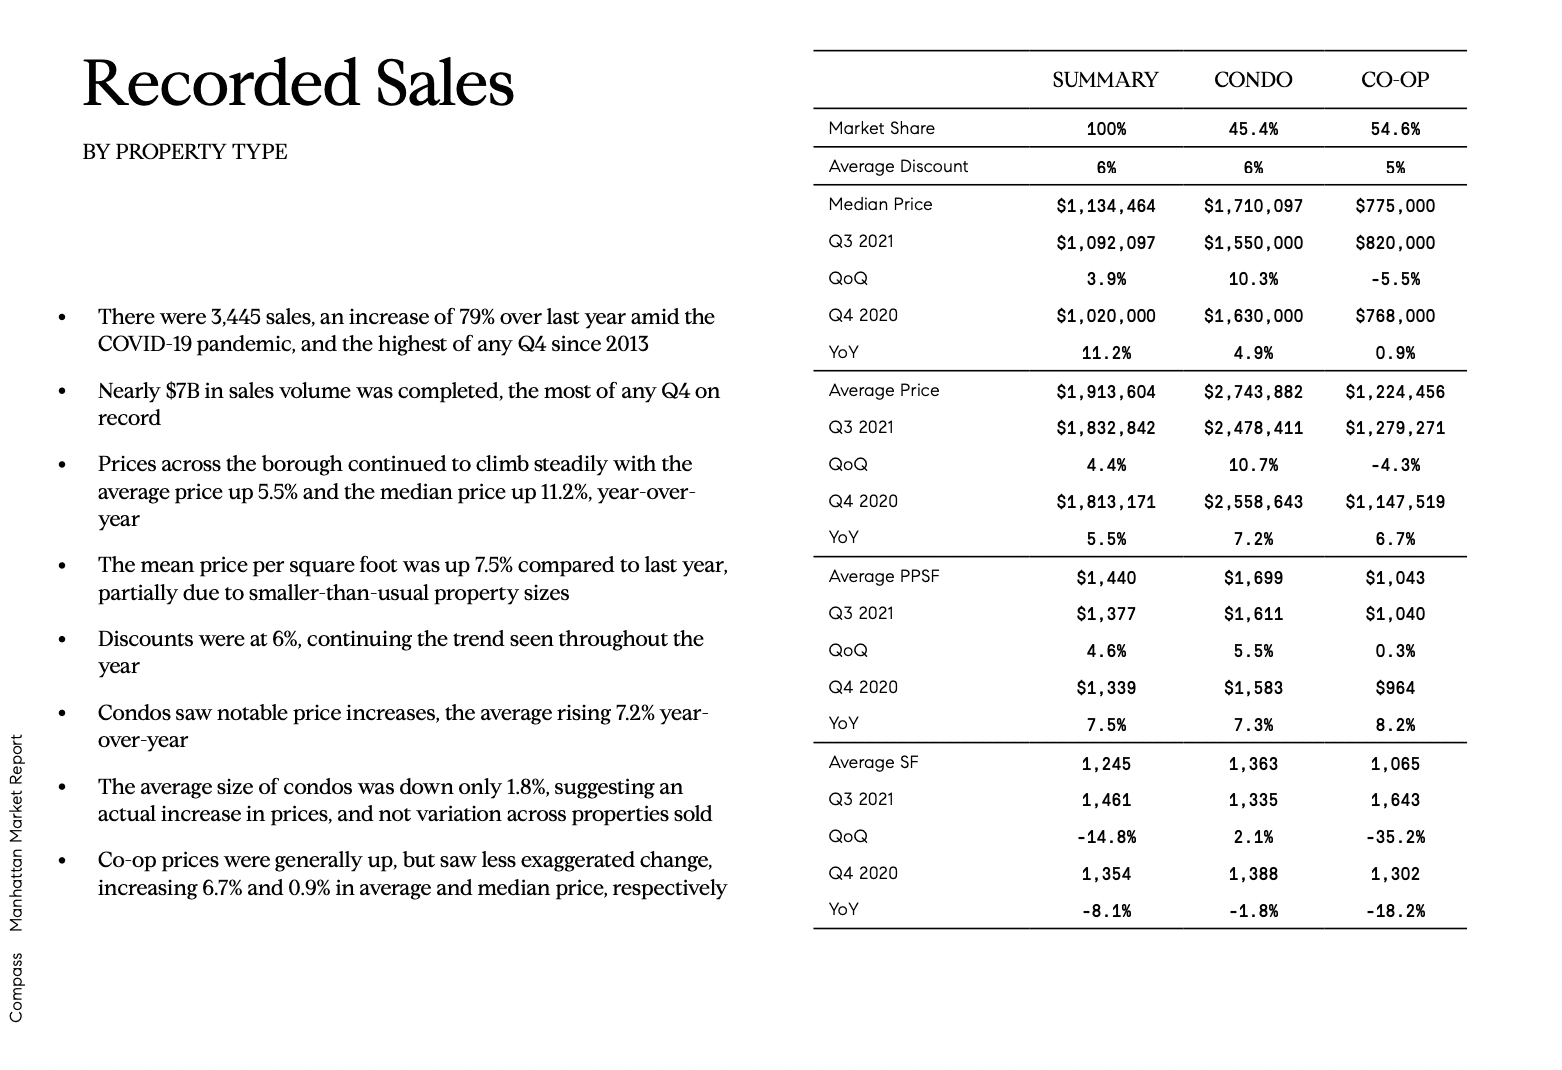
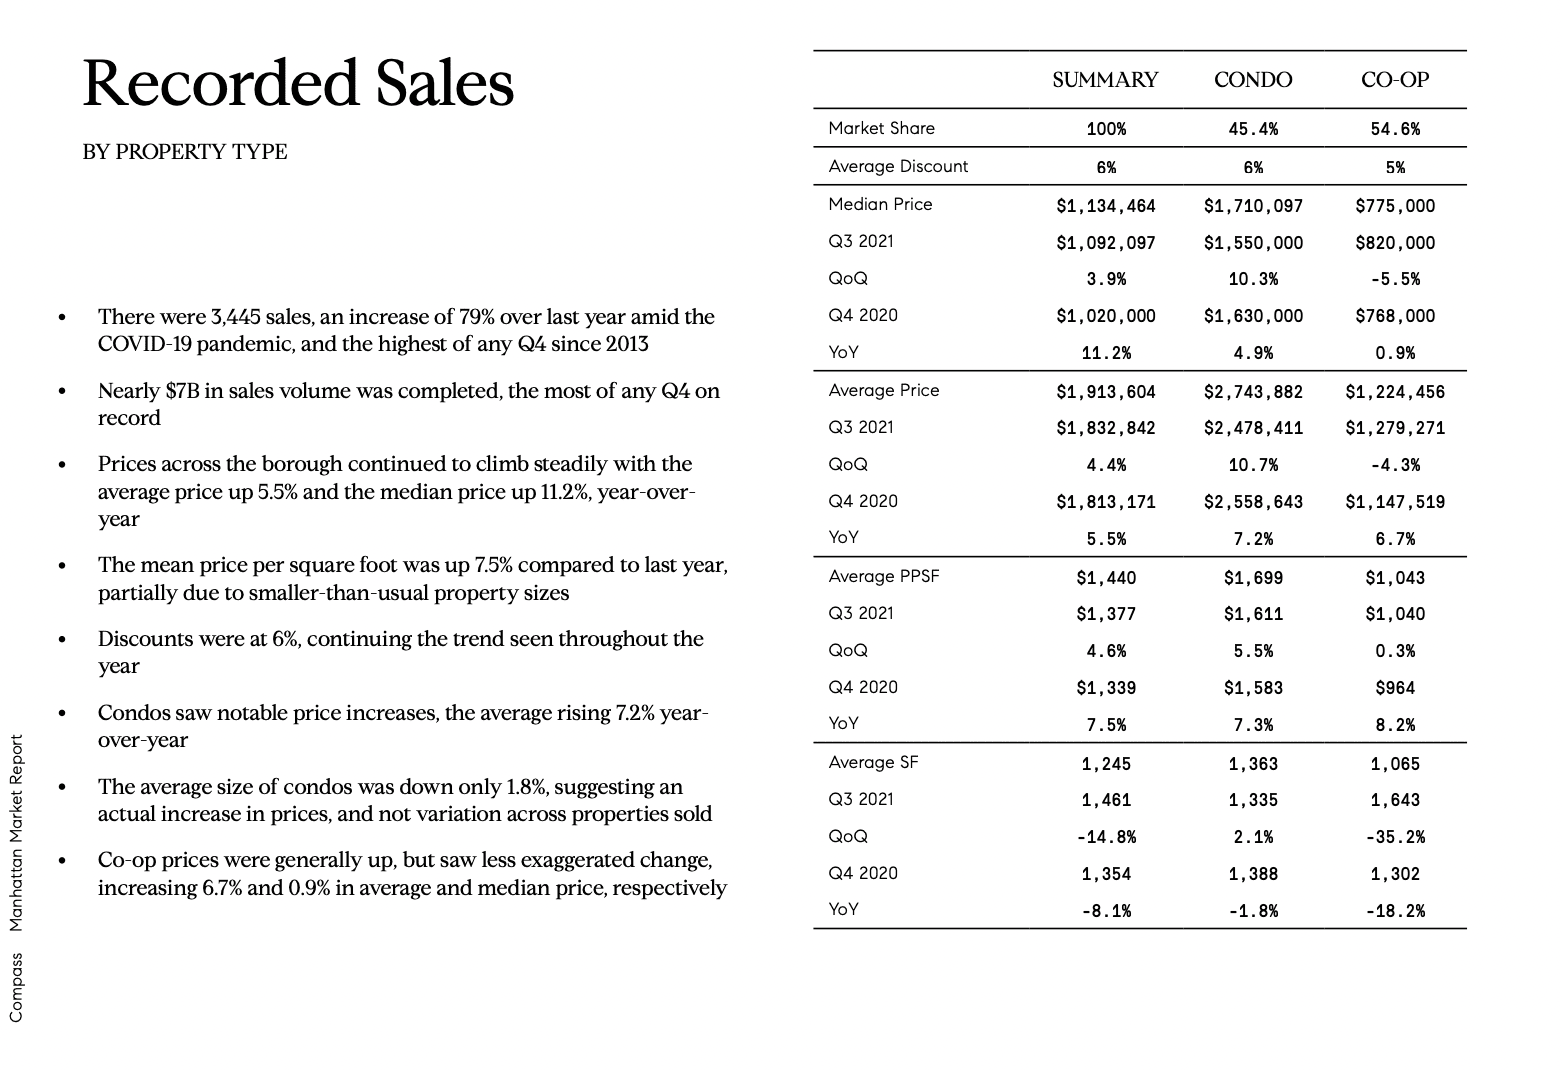
Manhattan Q4 2021 recorded sales report with market trends and condo and co-op statistics.Manhattan Q4 2021 recorded sales report with condo and co-op statistics and market highlights.


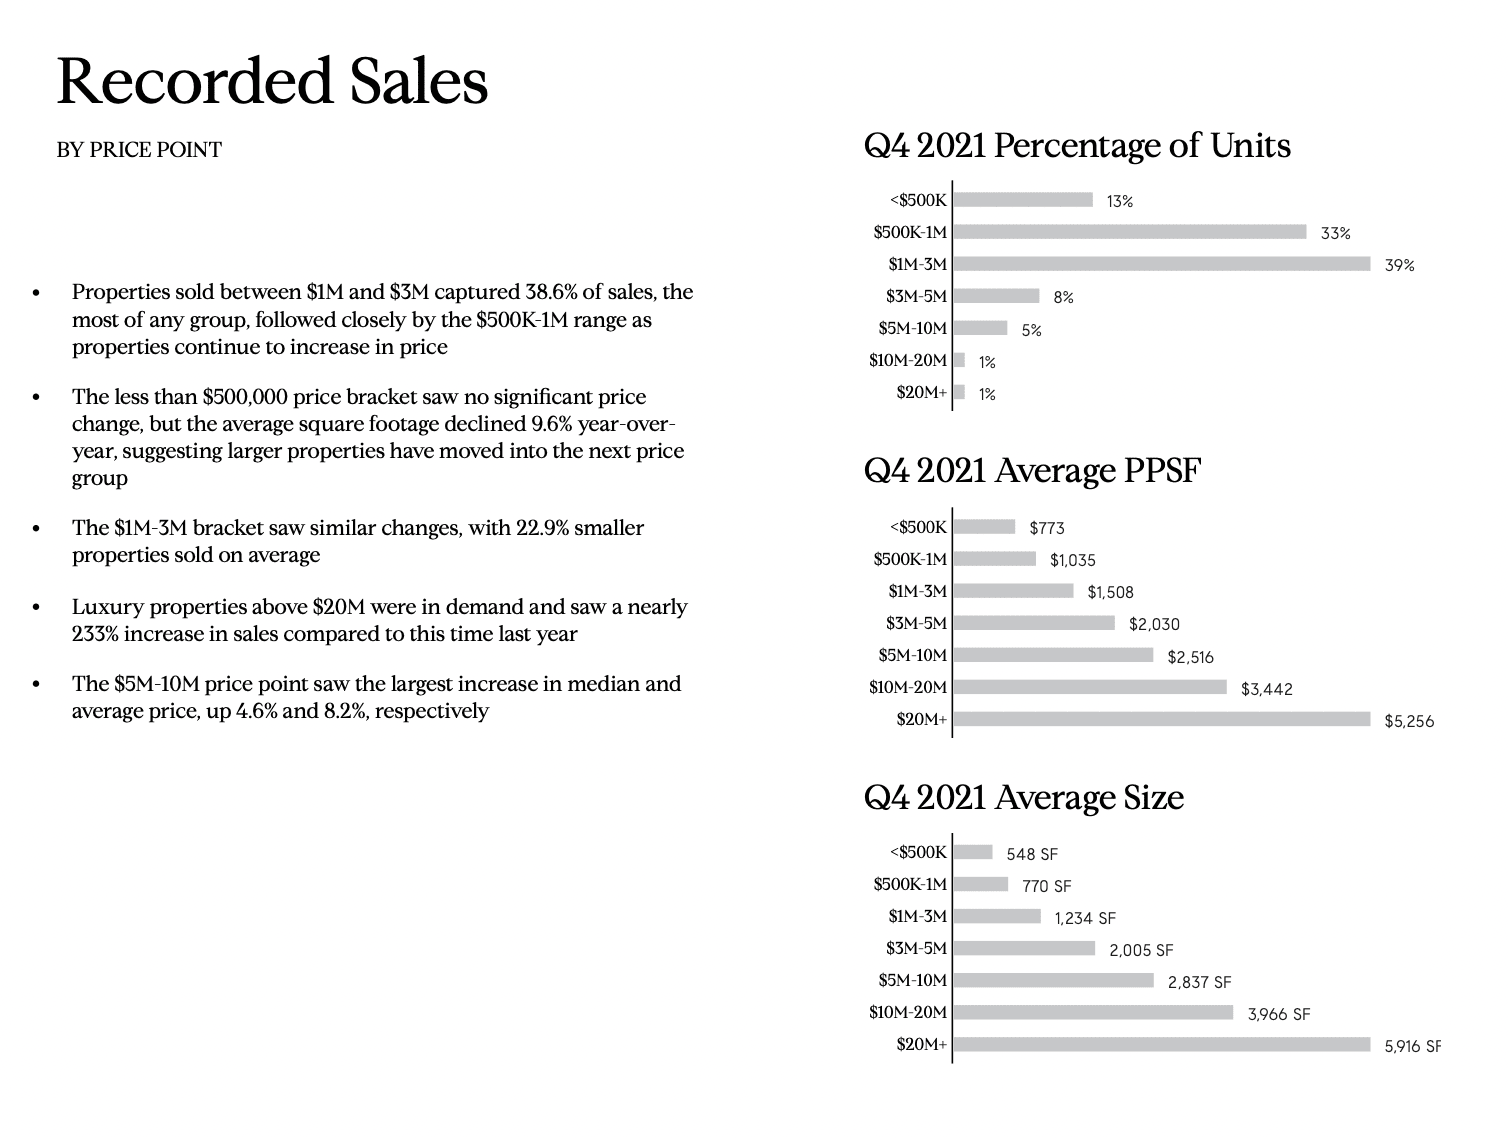
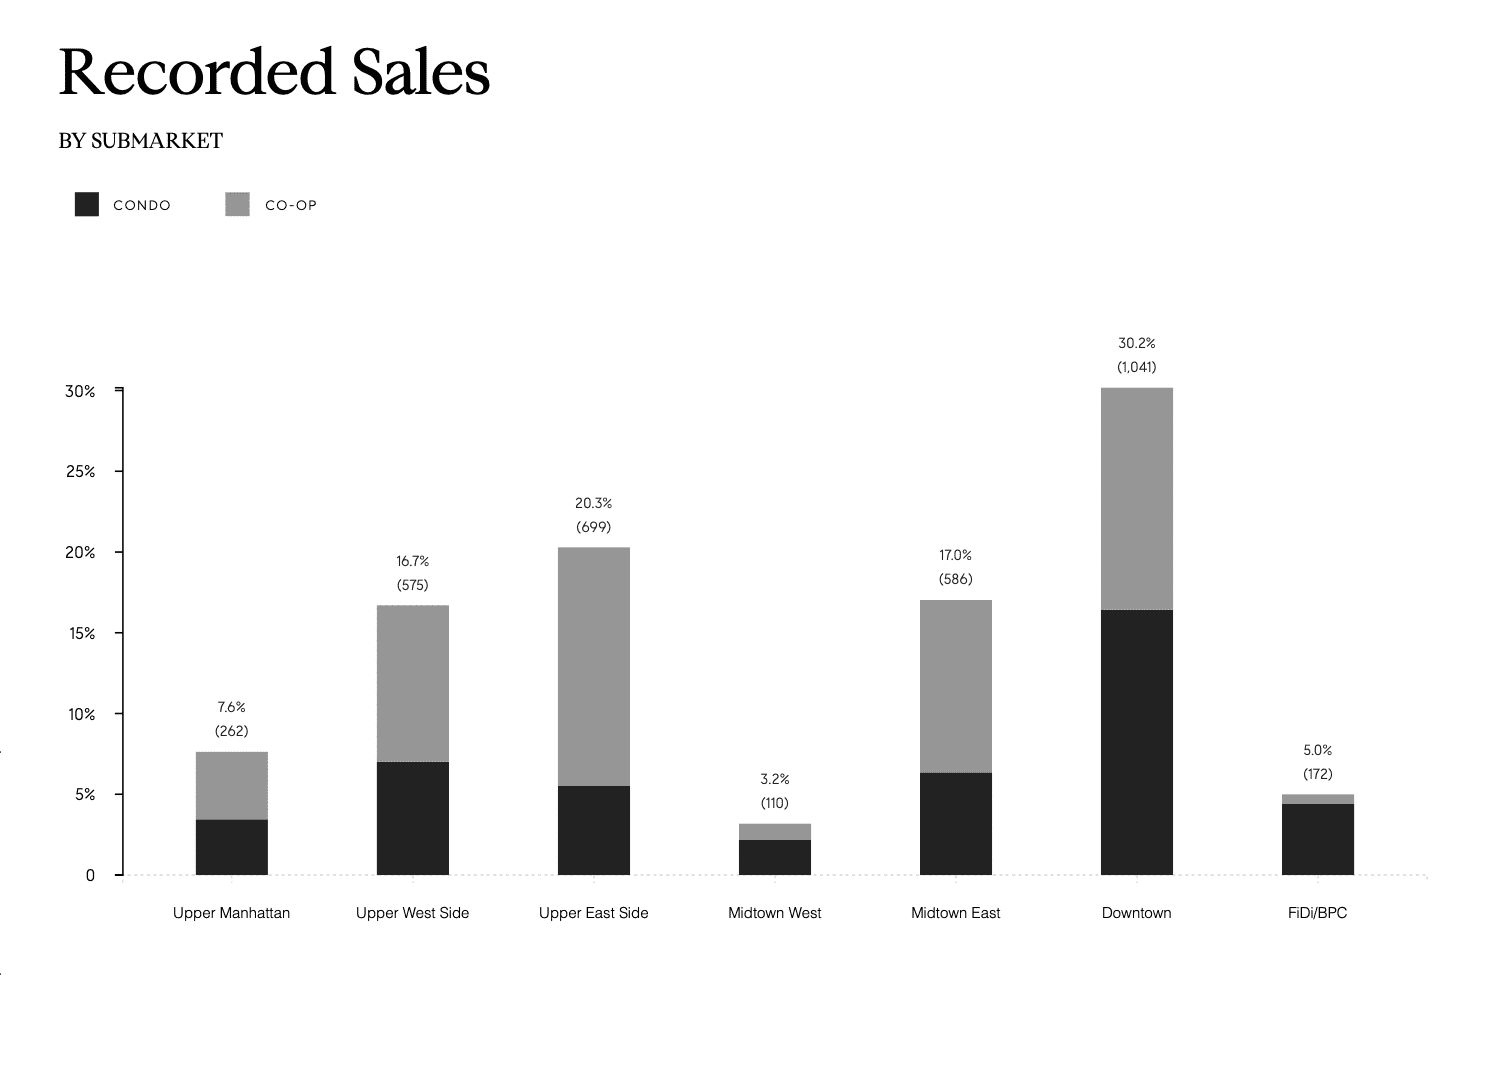
Manhattan Q4 2021 recorded sales infographic with price-bracket charts for unit share, average price per square foot, and size.Stacked bar chart of recorded condo and co-op sales by Manhattan submarket; Downtown leads at 30.2%.

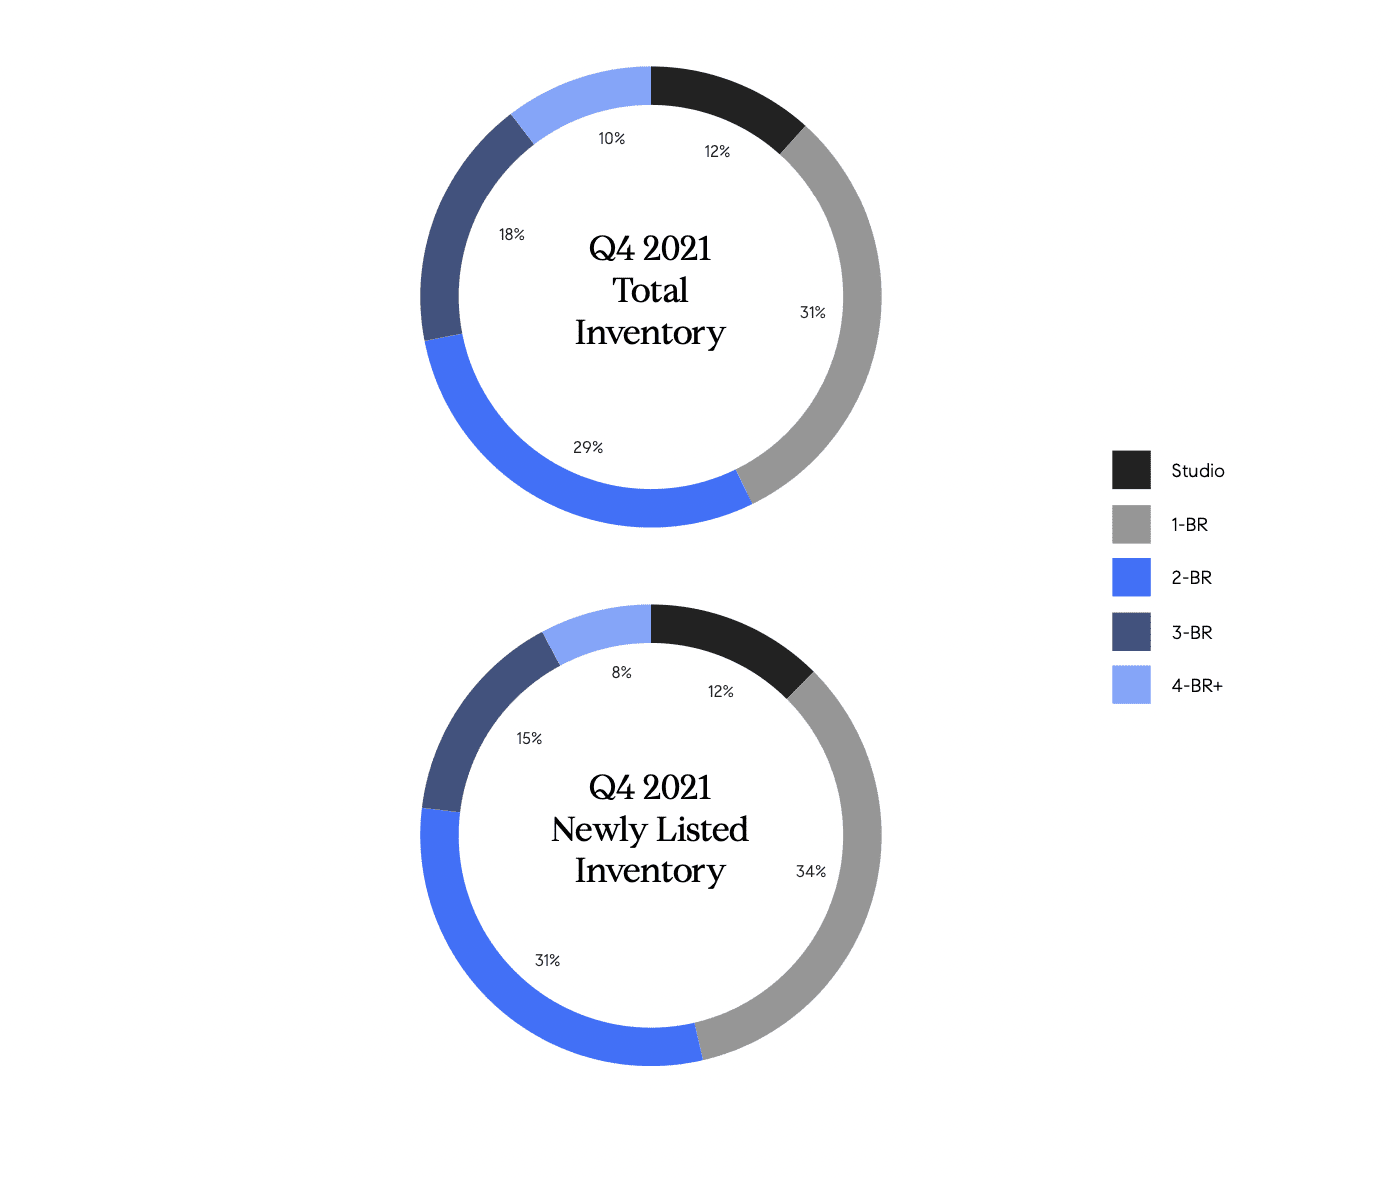
Donut charts showing Q4 2021 Manhattan total and newly listed inventory percentages by apartment size.

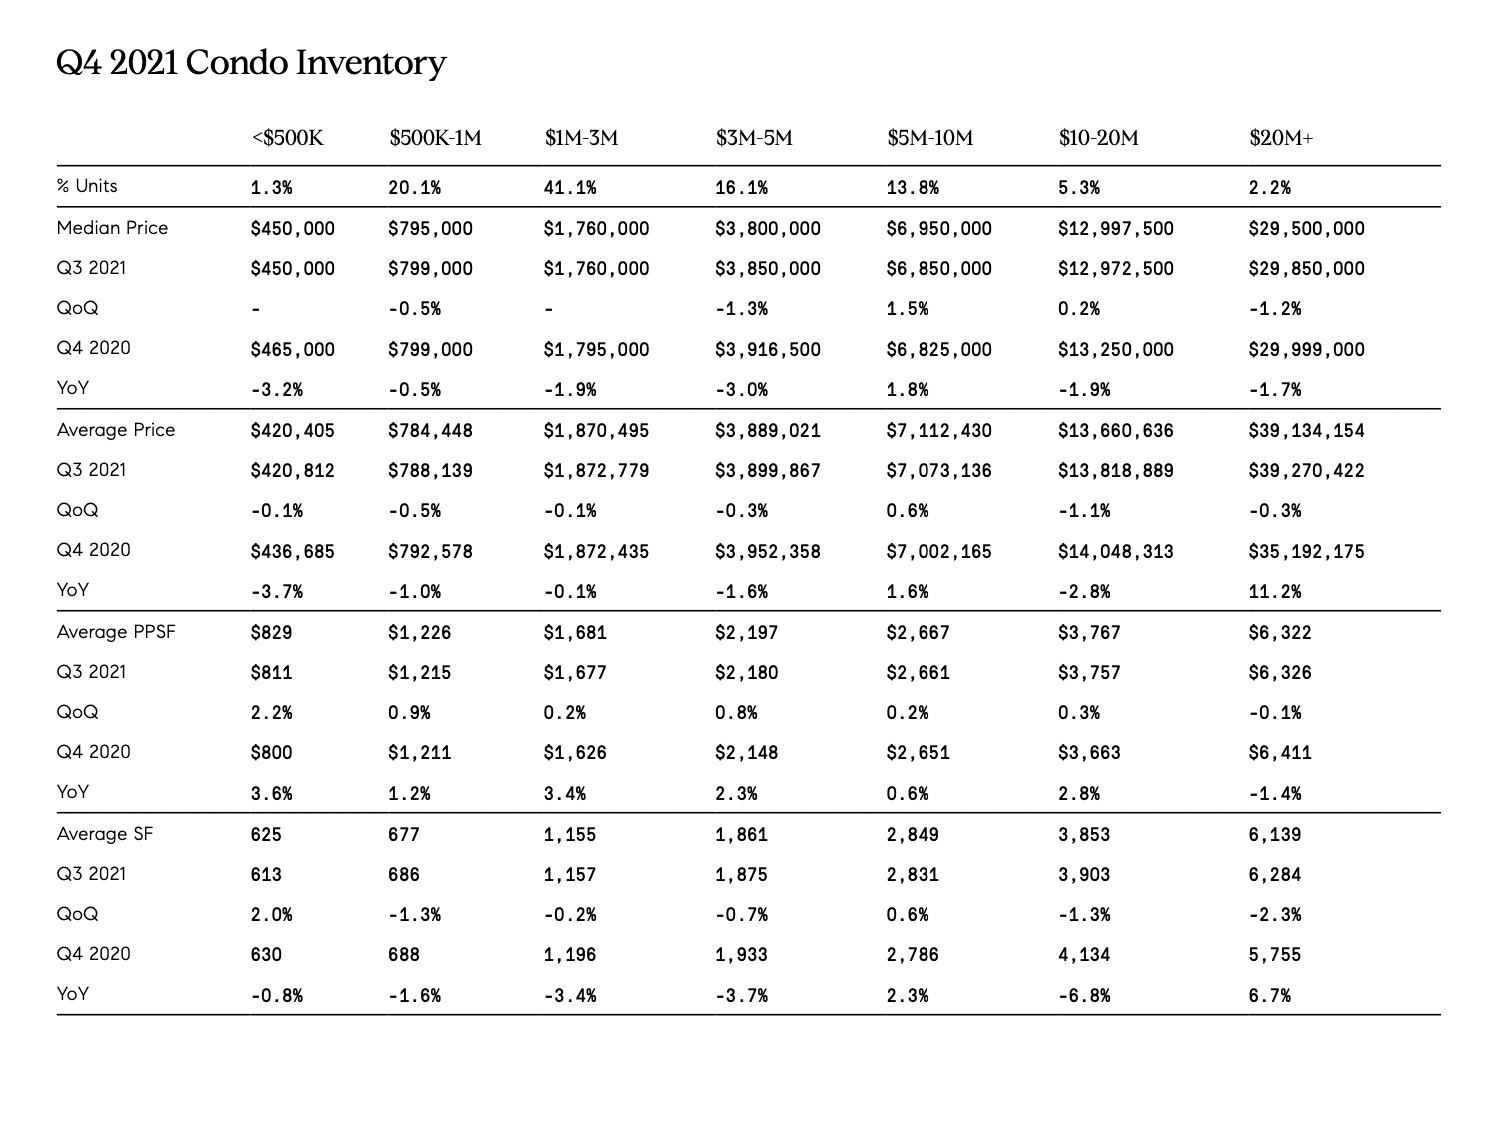
Q4 2021 Manhattan condo inventory and price statistics by price bracket, with quarterly and annual comparisons.

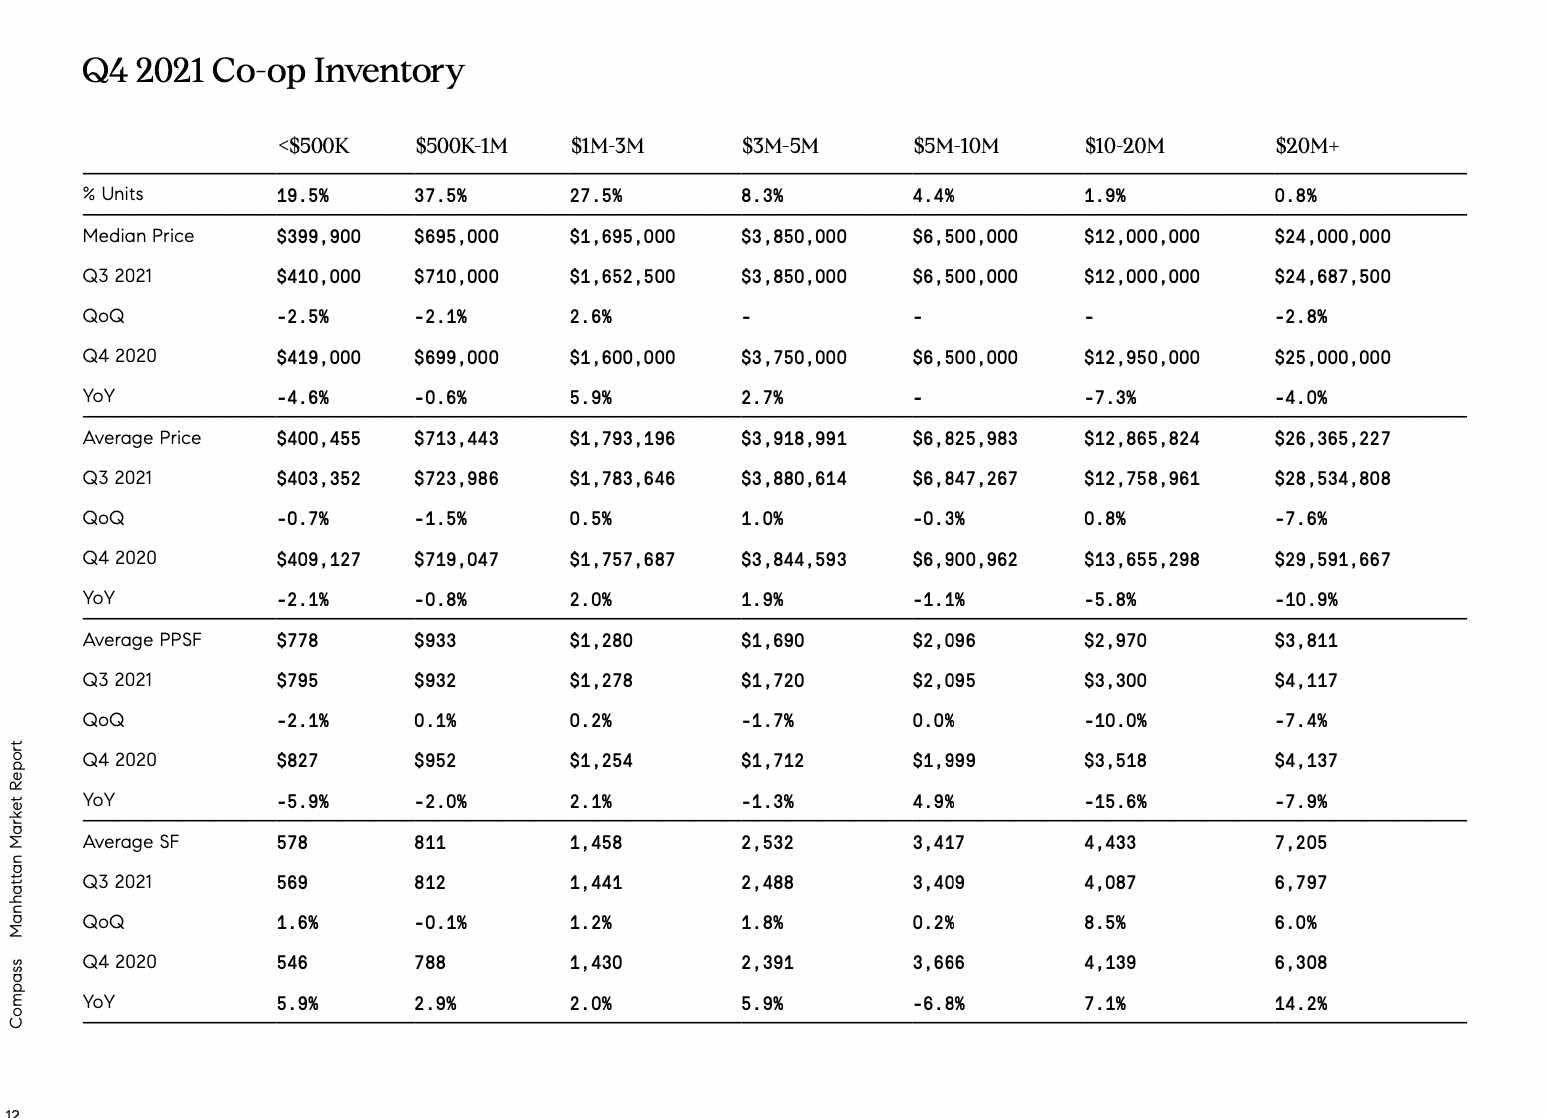
Q4 2021 co-op inventory table comparing Manhattan housing statistics across seven price ranges.


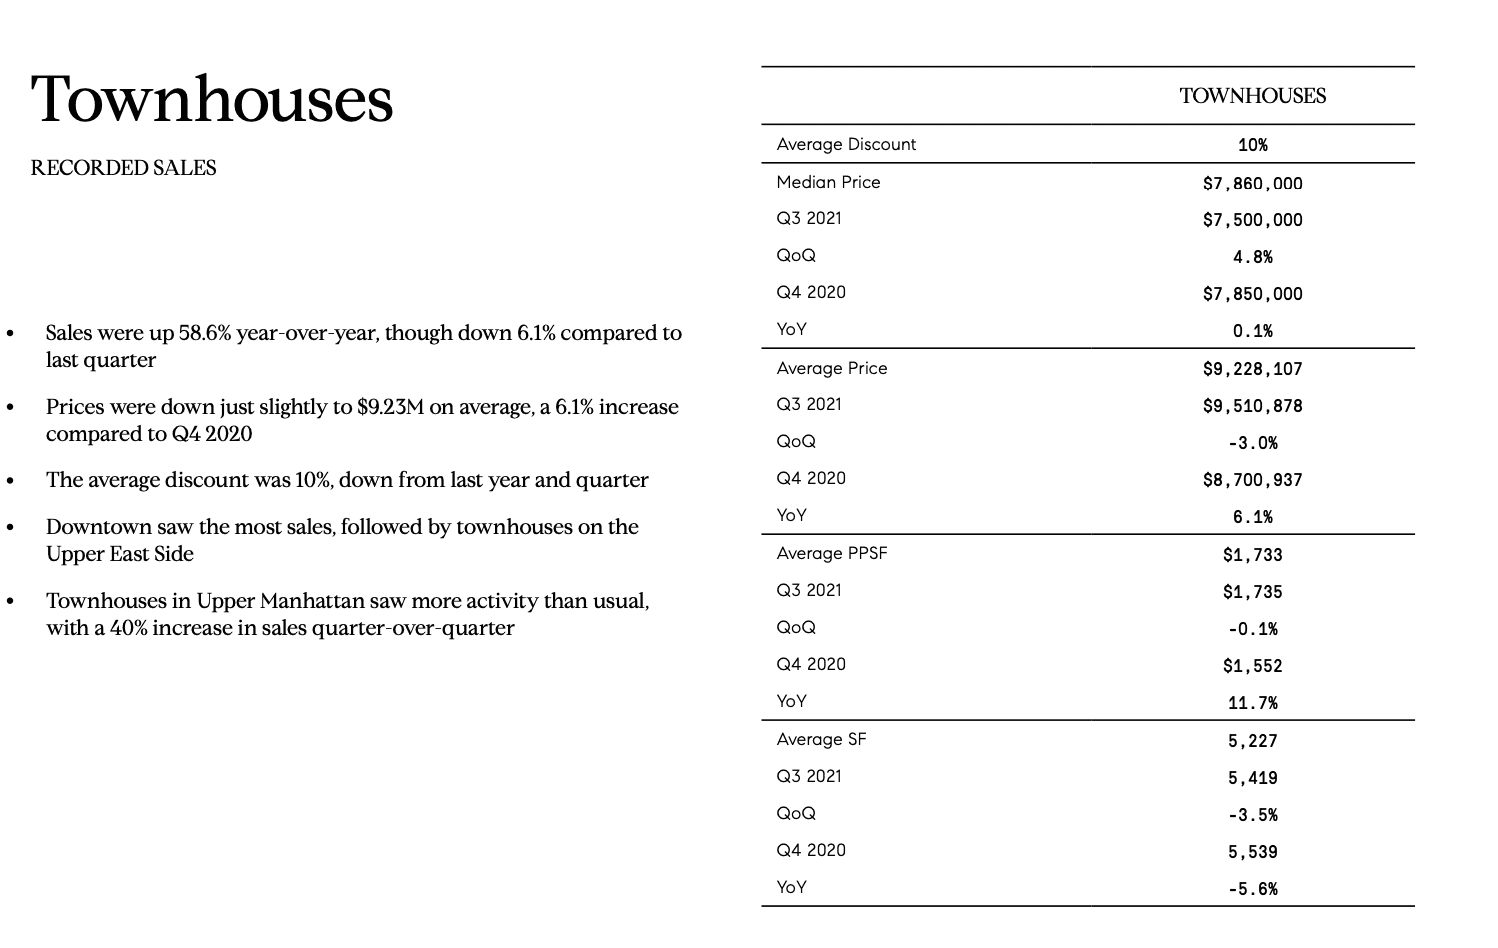
Manhattan Q4 2021 townhouse sales report with market highlights and pricing statistics.

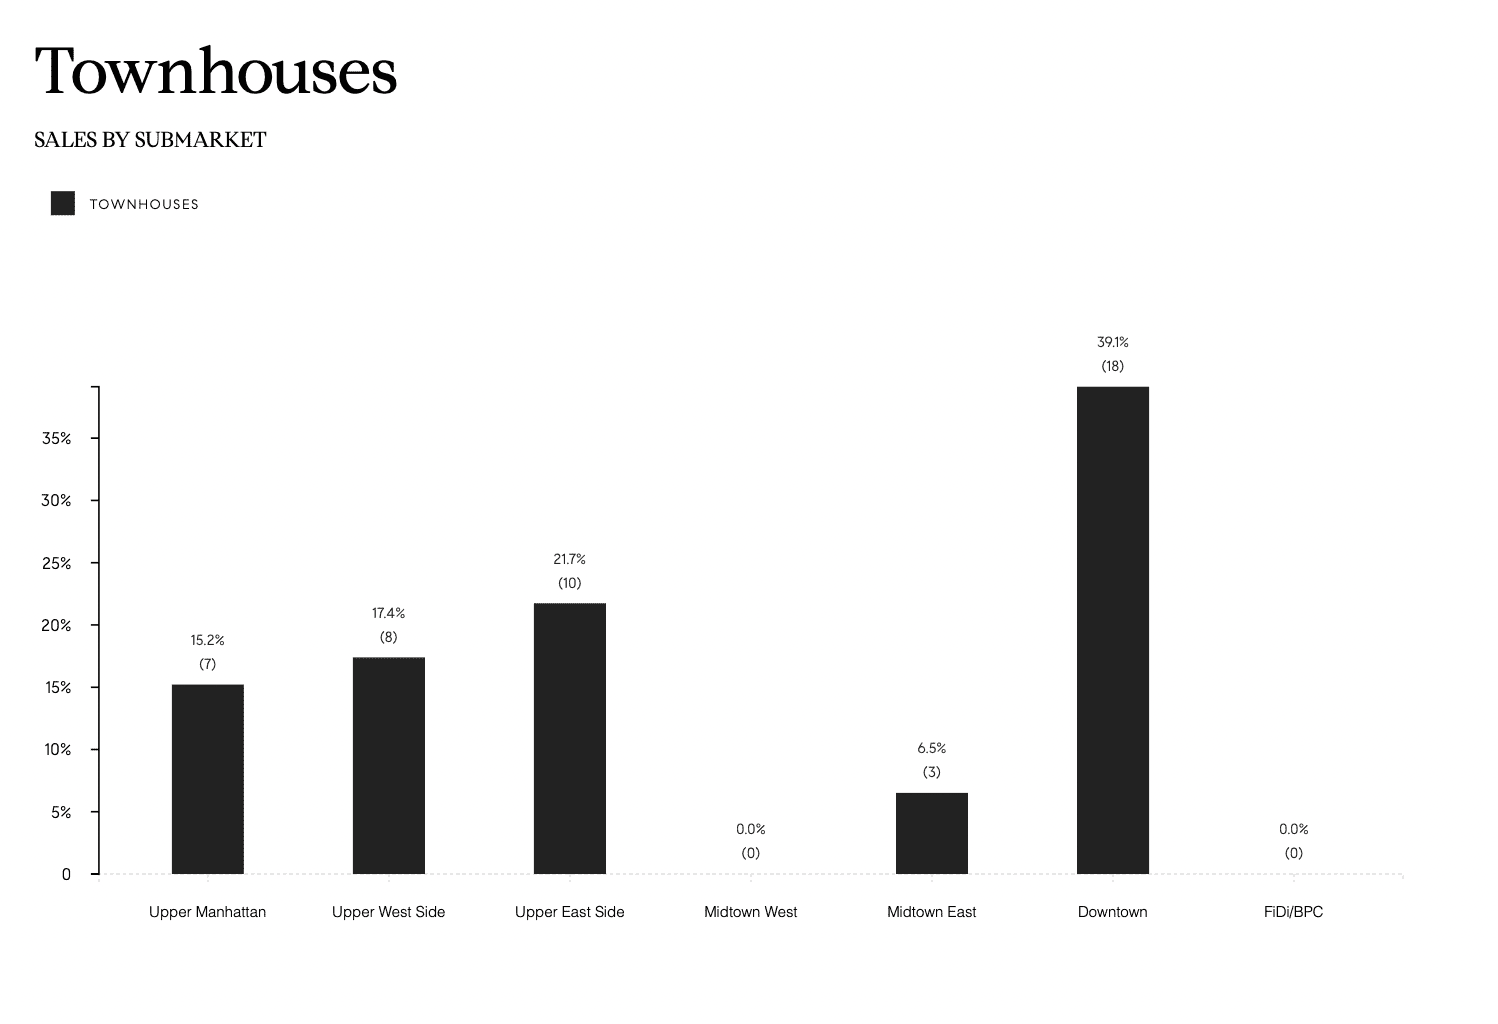
Manhattan townhouse sales by submarket: Downtown leads with 39.1% (18 sales); Midtown West and FiDi/BPC have none.

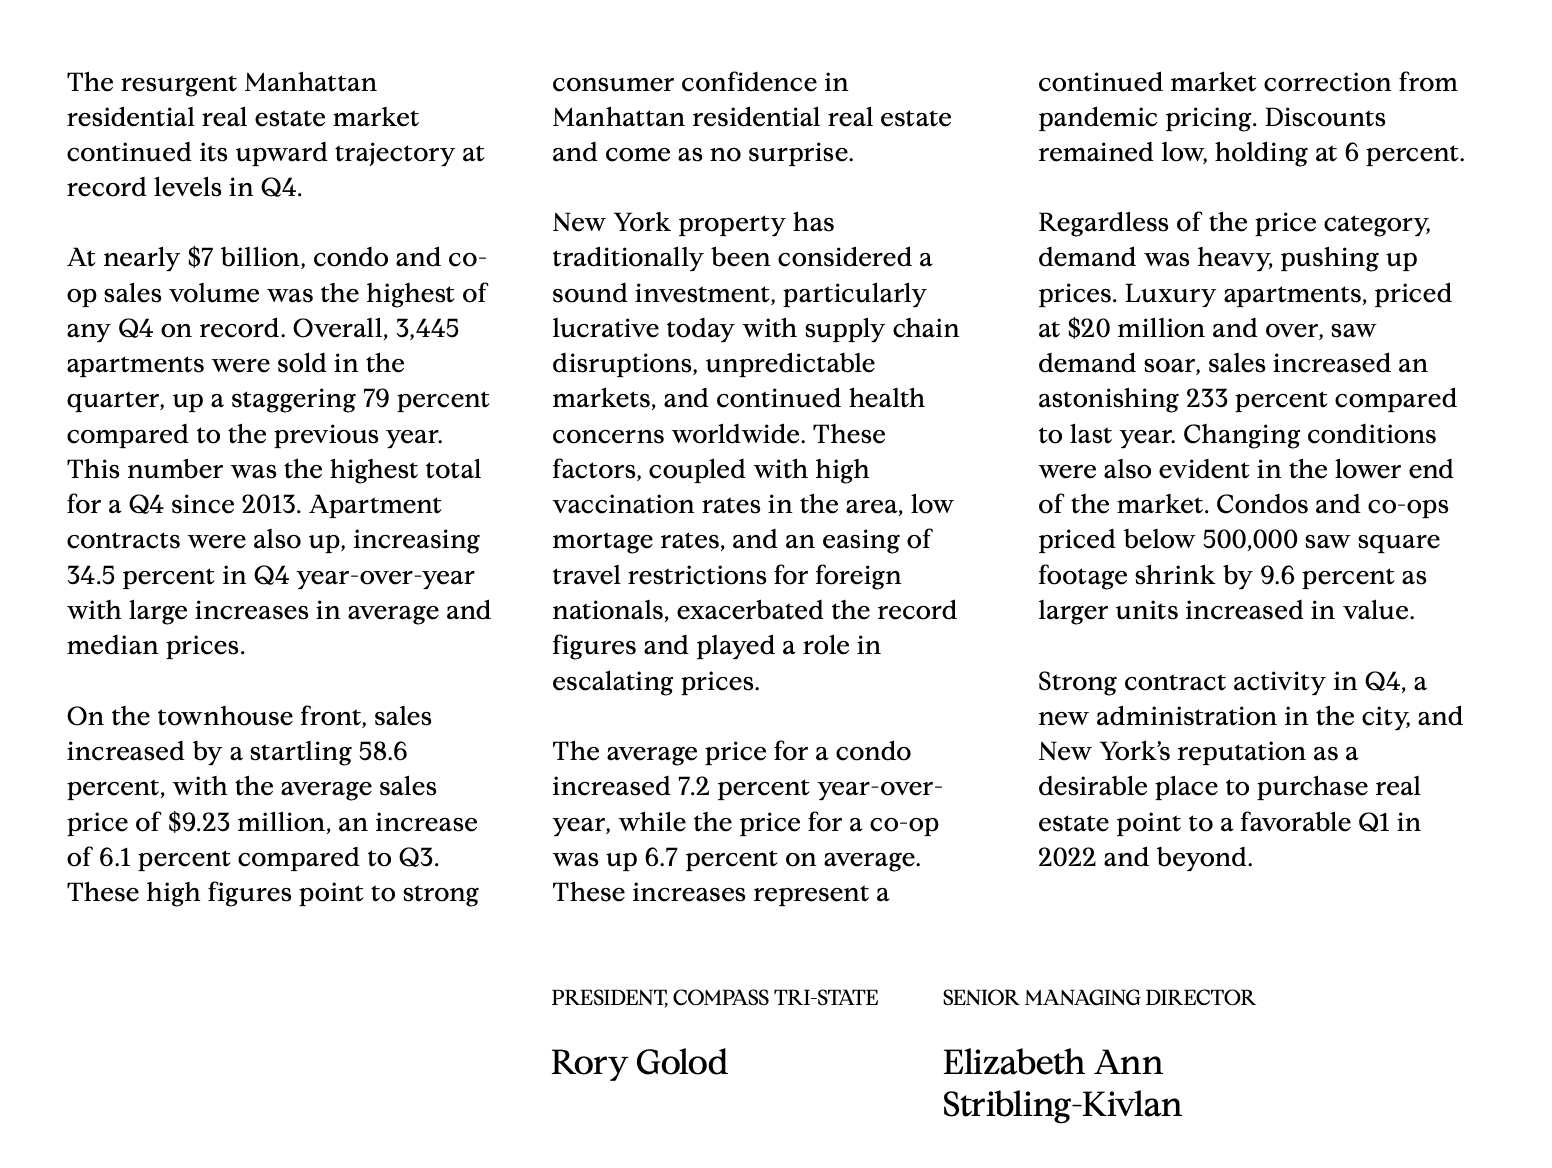
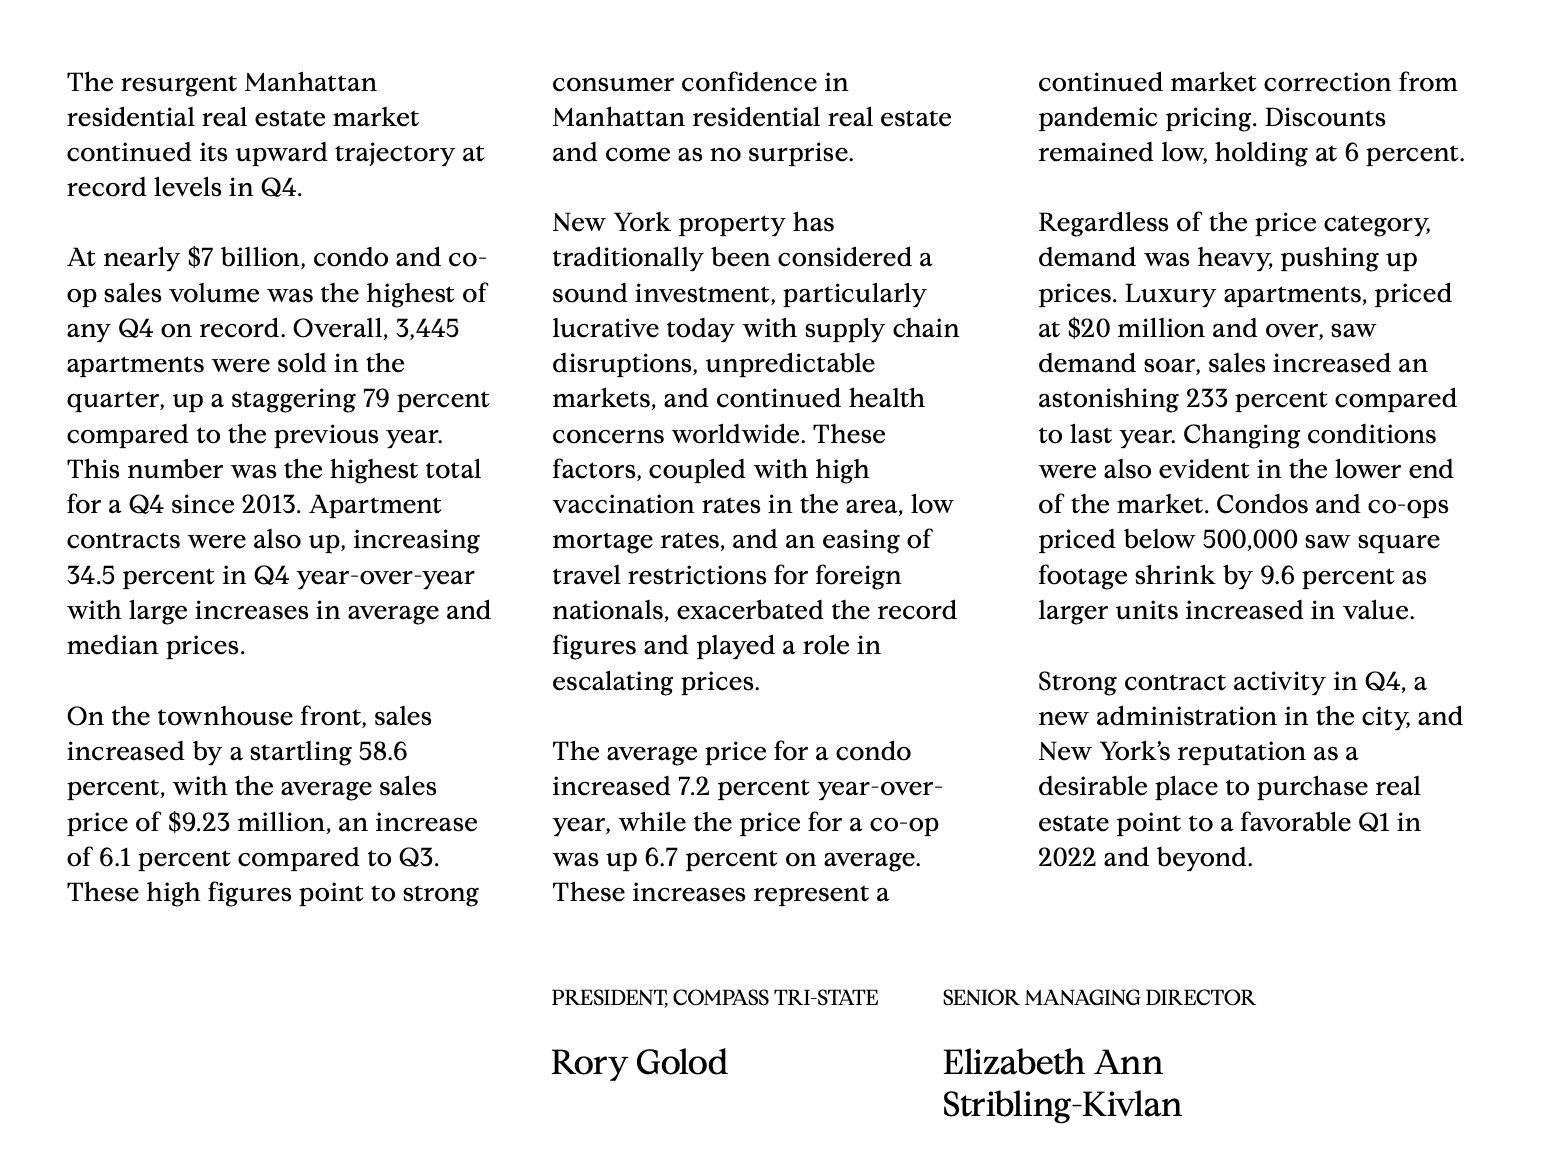
Manhattan Q4 2021 real estate report summarizing sales, prices, and market trends in three text columns.Manhattan Q4 2021 real estate report excerpt with market statistics and commentary.

Work With Michael

Finding an agent who is not only knowledgeable in both markets, but also trusted and respected can be tricky, but with Michael Meier representing you that is what you will have every time.